Getting Started
Week 1: Getting Started
1. Course orientation
2. Intro to conjoint analysis
3. Introductions
4. Getting started with R & Positron
Week 1: Getting Started
1. Course orientation
2. Intro to conjoint analysis
3. Introductions
4. Getting started with R & Positron
Meet your instructor!
John Helveston, Ph.D.
2025 - Present: Associate Professor, EMSE
2018 - 2025: Assistant Professor, EMSE
2016-2018: Postdoc at Institute for Sustainable Energy , Boston University
2016: PhD in Engineering & Public Policy at Carnegie Mellon University
2015: MS in Engineering & Public Policy at Carnegie Mellon University
2010: BS in Engineering Science & Mechanics at Virginia Tech
Website: www.jhelvy.com
Why
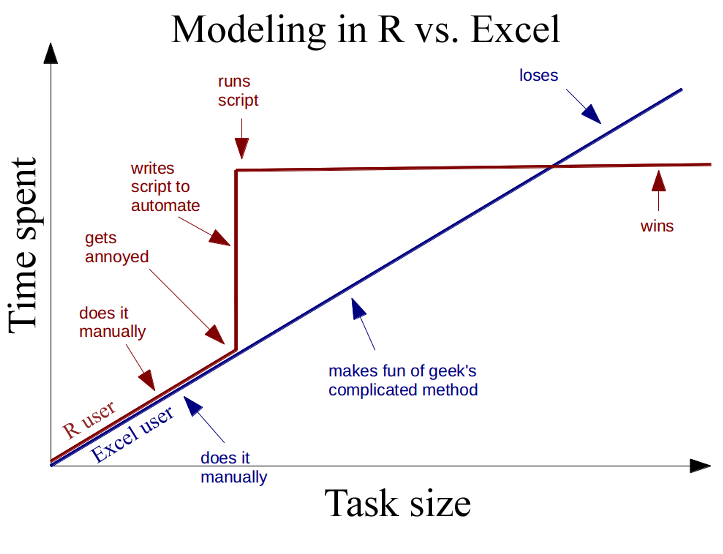
Wait, why aren’t we using Python?
The Marketing field out of Statistics, not Machine Learning
Python is a general purpose language developed by Guido van Rossum Unlike R, Python was not originally developed for data analysis.
Both languages are extremely useful, and you should probably learn python too .
Learning Objectives
After this class, you will know how to…
…work with data in …design effective surveys to get rich data …analyze consumer choice data to model consumer preferences …effectively communicate insights
Course prerequisites
This course requires prior exposure to:
Probability theory Multivariable calculus Linear algebra Regression
Weekly HW (30% of grade)
Do some readings, recorded lectures, practice problems
Write a short reflection
Quizzes (10% of grade)
Exam (10% of grade)
In-person, first 45 minutes of class on 12/2
All hand-written (like a long quiz)
Teams of 3-4 students
Goals:
Assess market viability of a new technology or design
Recommend best design choices for target market or application
Key deliverables:
Project Proposal
5 %
Sep. 21
Survey Plan
5 %
Sep. 30
Pilot Survey
5 %
Oct. 14
Pilot Analysis
5 %
Nov. 02
Final Survey
5 %
Nov. 16
Final Analysis Report
15 %
Dec. 07
Final Presentation
5 %
Dec. 09
Grades
Grades
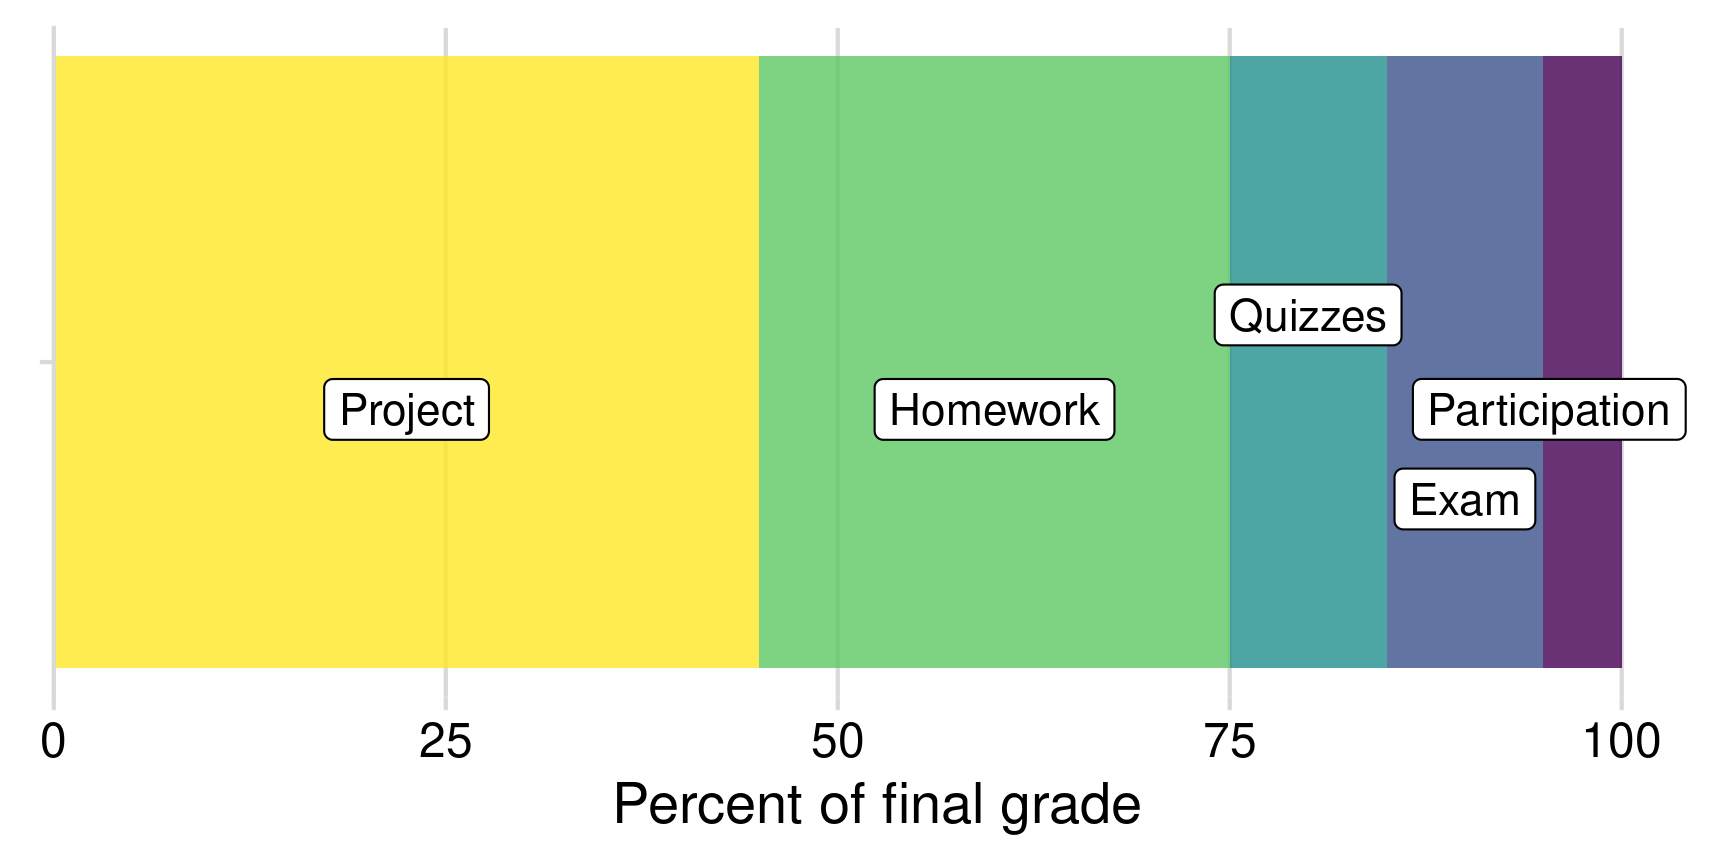
Participation / Attendance
5%
(Yes, I take attendance)
Homework
30 %
13 assignments (12 x 2.5%, lowest dropped)
Quizzes
10 %
6 quizzes, lowest dropped
Final Exam
10 %
In class, closed book (12/2)
Project Proposal
5 %
Teams of 3-4 students
Survey Plan
5 %
Pilot Survey
5 %
Pilot Analysis
5 %
Final Survey
5 %
Final Analysis Report
15 %
Final Presentation
5 %
Course policies
BE NICE BE HONEST DON’T CHEAT
Copying is good, stealing is bad
“Plagiarism is trying to pass someone else’s work off as your own. Copying is about reverse-engineering.”
– Austin Kleon, from Steal Like An Artist
Use of AI
Large language models (LLMs) are pretty good
Sometimes they suck.
I will grade whatever you submit. It should not suck.
Ways to not have your work suck:
Don’t submit code that doesn’t run (actually run it before submitting it).
Actually read what the AI generates, and don’t submit something you don’t understand . (Ask the LLM to explain why something works or doesn’t work)
Use the approach I teach : agentic workflows (starting next week)
Late submissions
- 3 late days - use them anytime, no questions asked
- No more than 2 late days on any one assignment
How to succeed in this class
read carefully !
Getting Help
Use
Slack to ask questions.
Mondays from 8:00-4:30pm
Tuesdays from 8:00-4:30pm
Fridays from 8:00-4:00pm
Week 1: Getting Started
1. Course orientation
2. Intro to conjoint analysis
3. Introductions
4. Getting started with R & Positron
Engineers often design things nobody wants!
We want to answers to questions like…
- Higher prices decrease demand, but by how much?
- How will my product compete against competitors in the market?
Answers depend on knowing what people want
Directly asking people what they want isn’t always helpful
(People want everything)
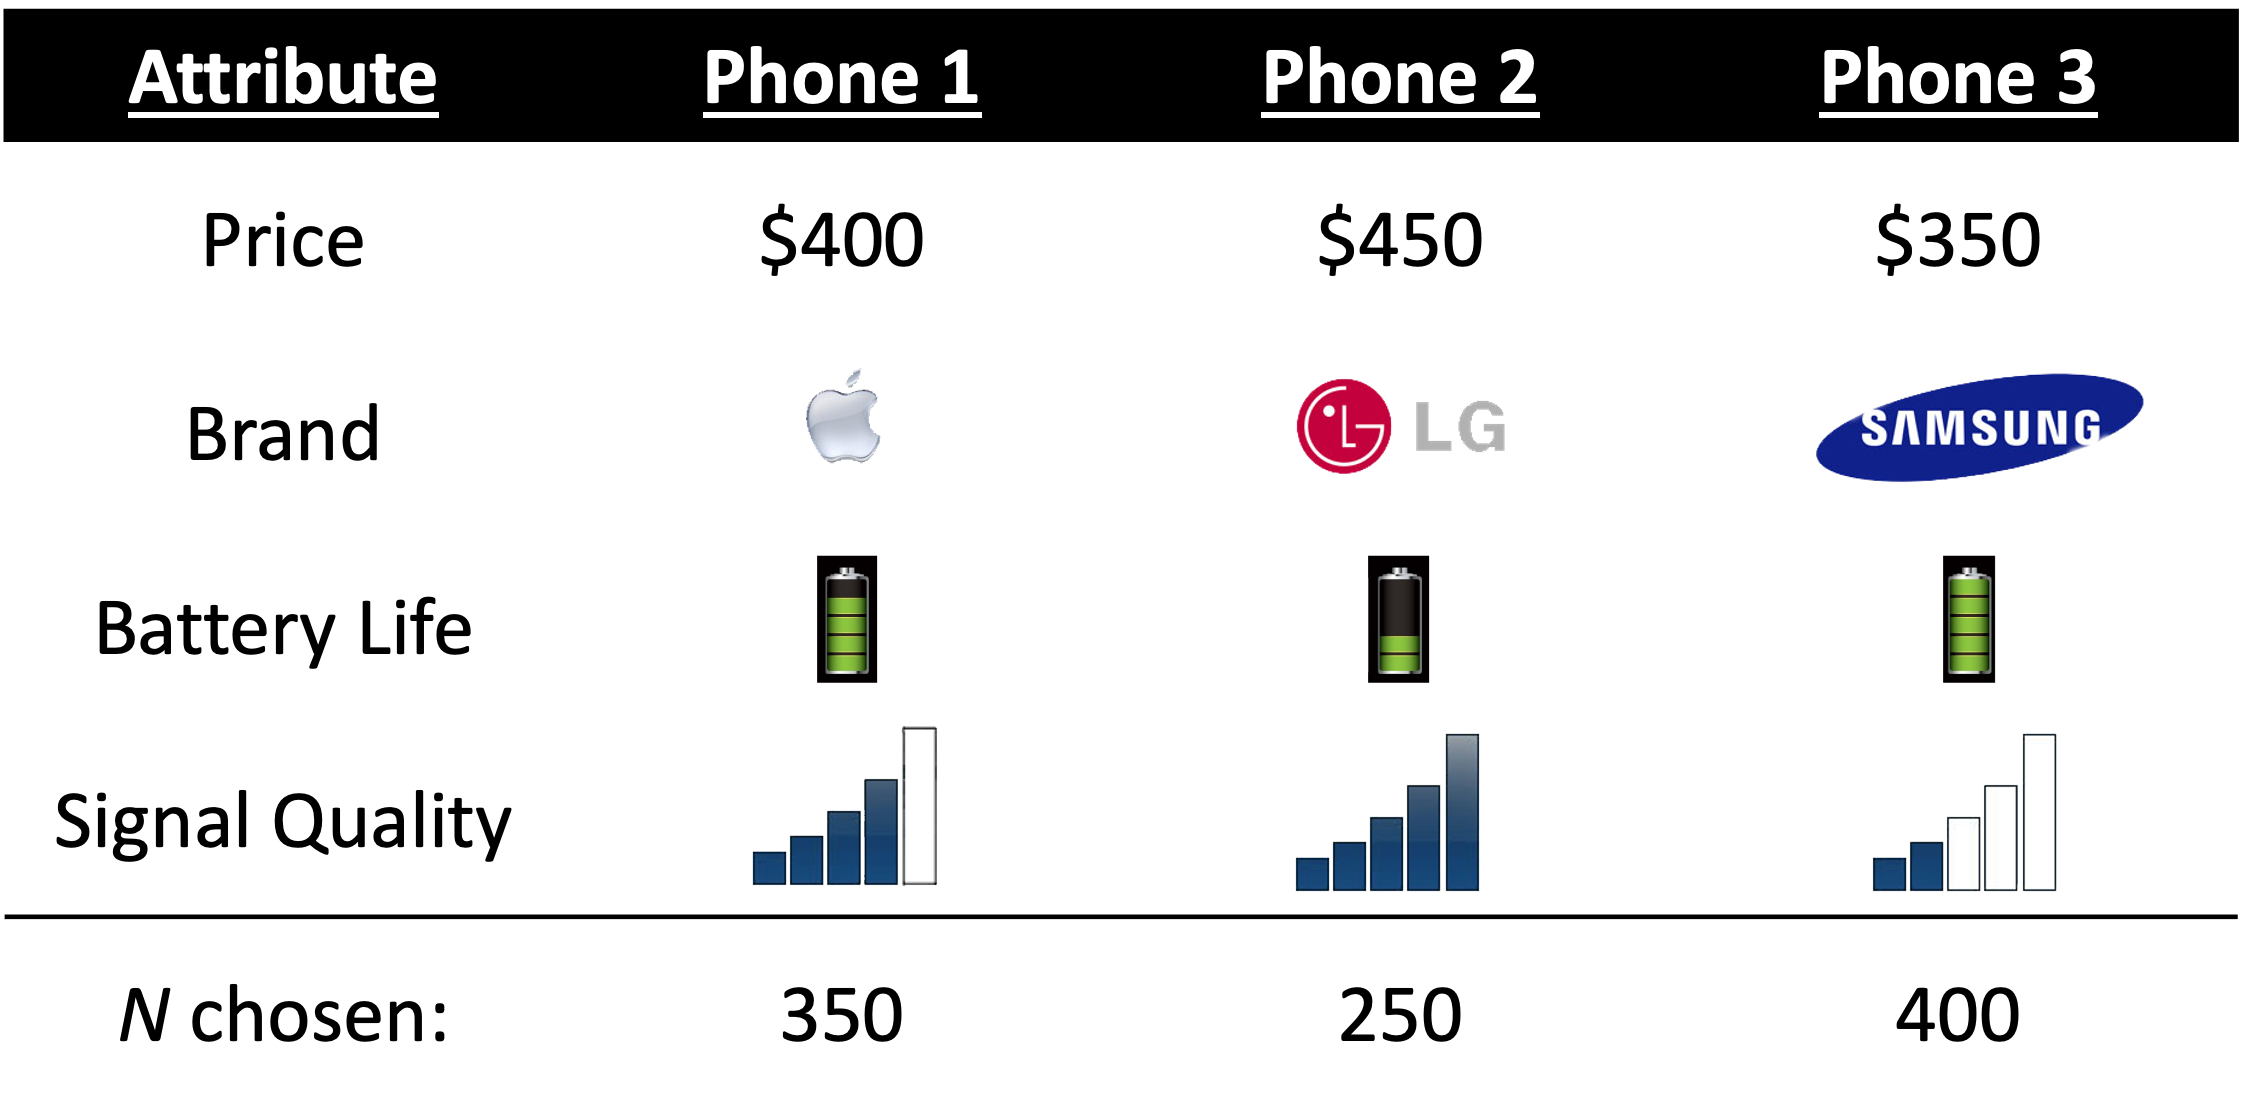
Which feature do you care more about?
Battery Life?
Brand?
Signal quality?
Conjoint approach :
Use random utility framework to predict probability of choosing phone j
1. \(u_j = \beta_1\mathrm{price}_j + \beta_2\mathrm{brand}_j + \beta_3\mathrm{battery}_j + \beta_4\mathrm{signal}_j + \varepsilon_j\)
2. Assume \(\varepsilon_j \sim\) iid extreme value
3. Probability of choosing phone j : \(P_j = \frac{e^{\beta'x_j}}{\sum_k^J e^{\beta'x_k}}\)
4. Estimate \(\beta_1\) , \(\beta_2\) , \(\beta_3\) , \(\beta_4\) by minimizing \(-L = - \sum_n^N \sum_j^J y_{nj} \ln P_{nj}\)
Willingness to Pay
\(u_j = \beta'x_j + \alpha p_j + \varepsilon_j\)
\(\omega = \frac{\beta}{-\alpha}\)
Respondents on average are willing to pay $XX to improve battery life by XX%
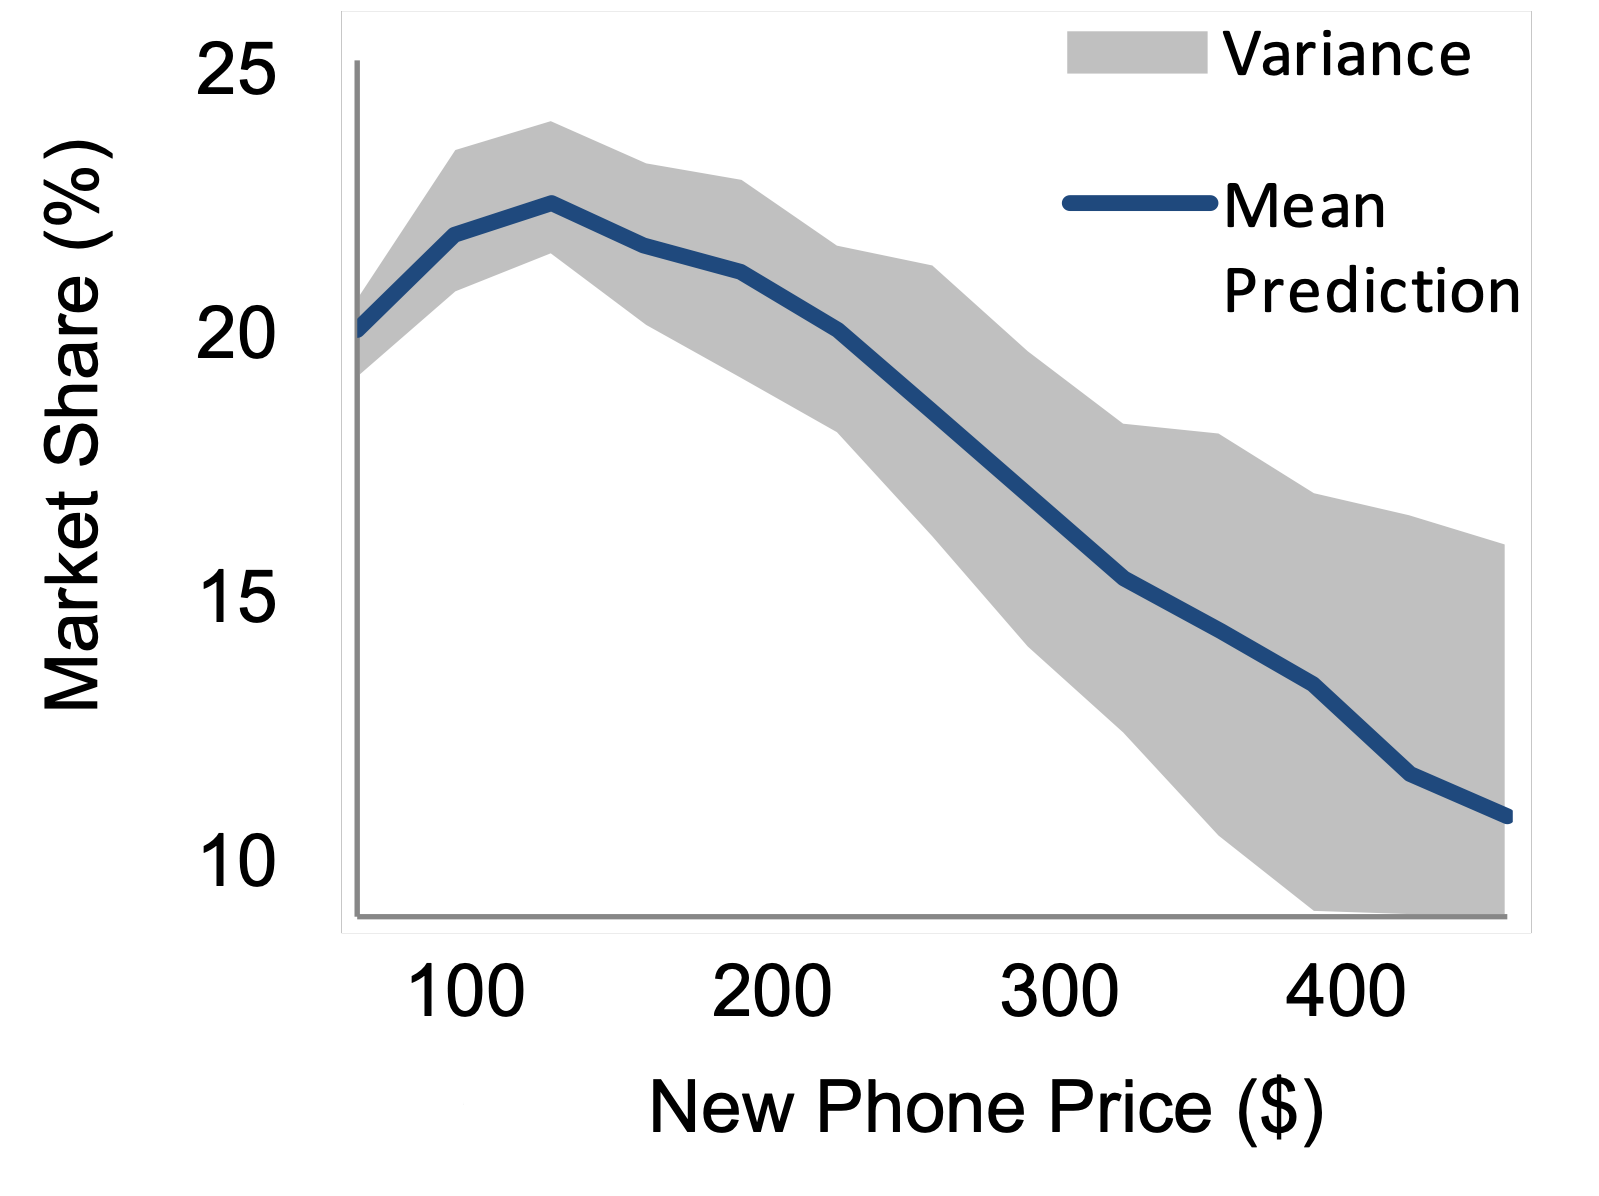
Make predictions
\(P_j = \frac{e^{\hat{\beta}'x_j}}{\sum_k^J e^{\hat{\beta}'x_k}}\)
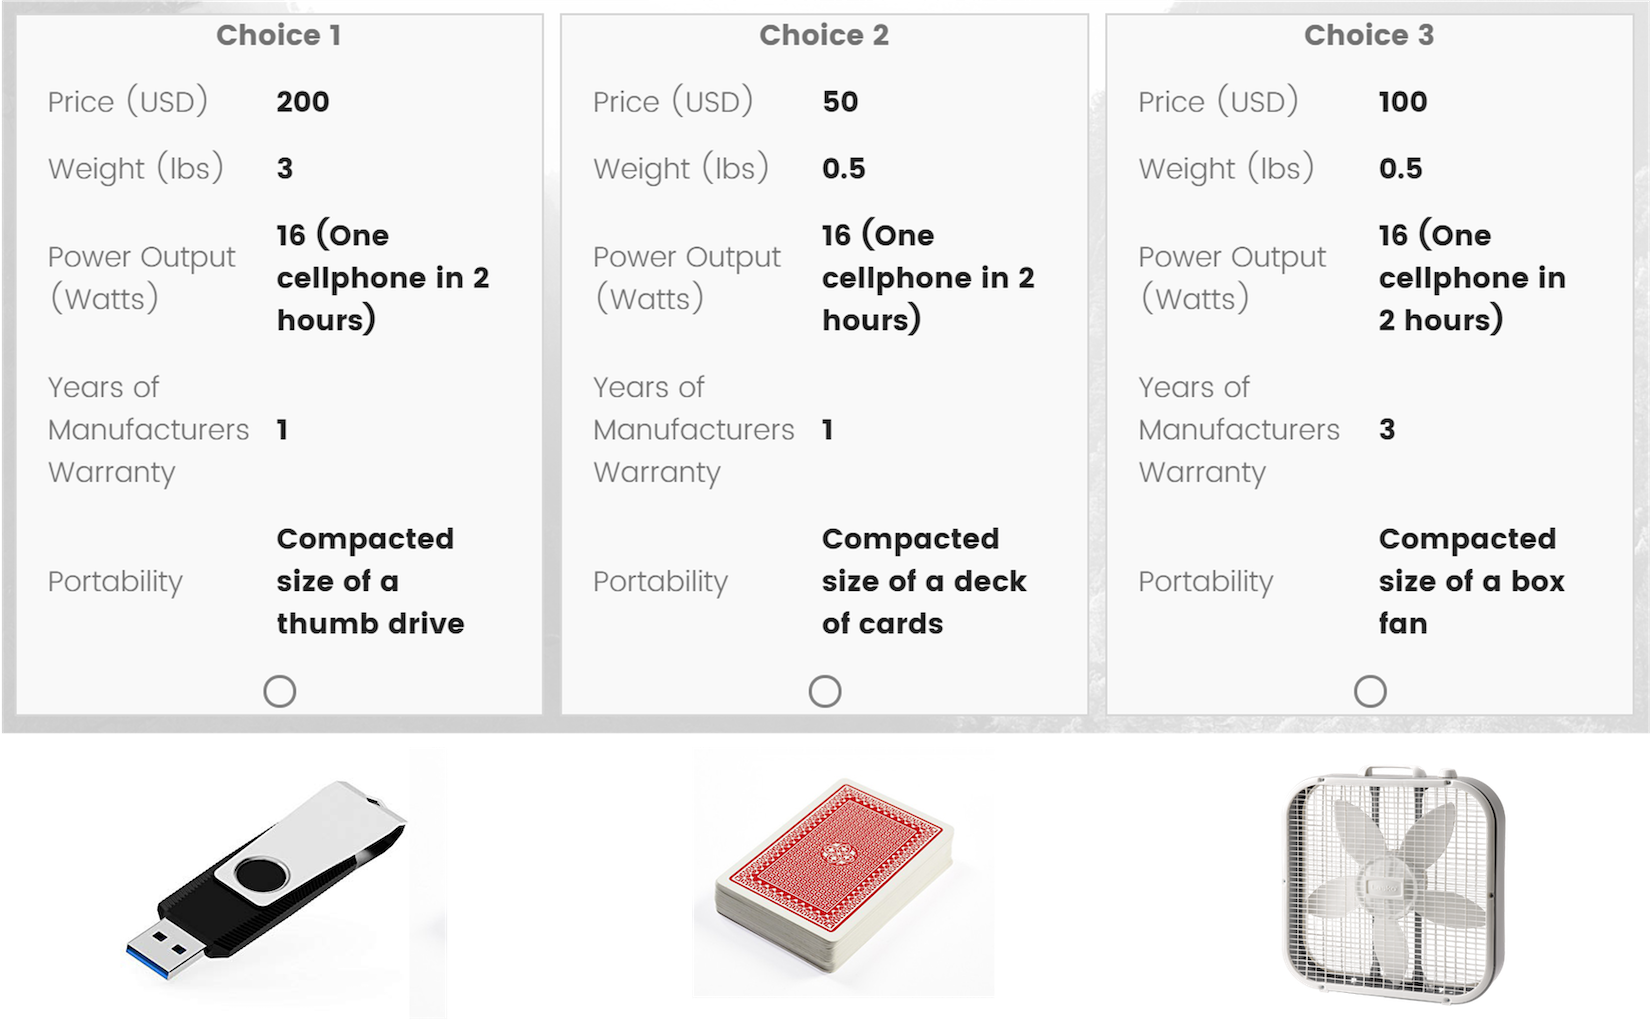
Example: Pocket Charge
A Flexible, Portable Solar Charger
Example survey choice question
Week 1: Getting Started
1. Course orientation
2. Intro to conjoint analysis
3. Introductions
4. Getting started with R & Positron
Introduce yourself
- Preferred name
- Degree program
- Prior experience
- What do you hope to gain from this class?
- Project interests?
Break
If you haven’t already, install everything on the software page
Add your GitHub username to this sheet (you need this to get your course repo!)
Stand up, meet each other, (maybe form teams?…use this sheet )
Week 1: Getting Started
1. Course orientation
2. Intro to conjoint analysis
3. Introductions
4. Getting started with R & Positron
This semester we use Positron
(not RStudio)
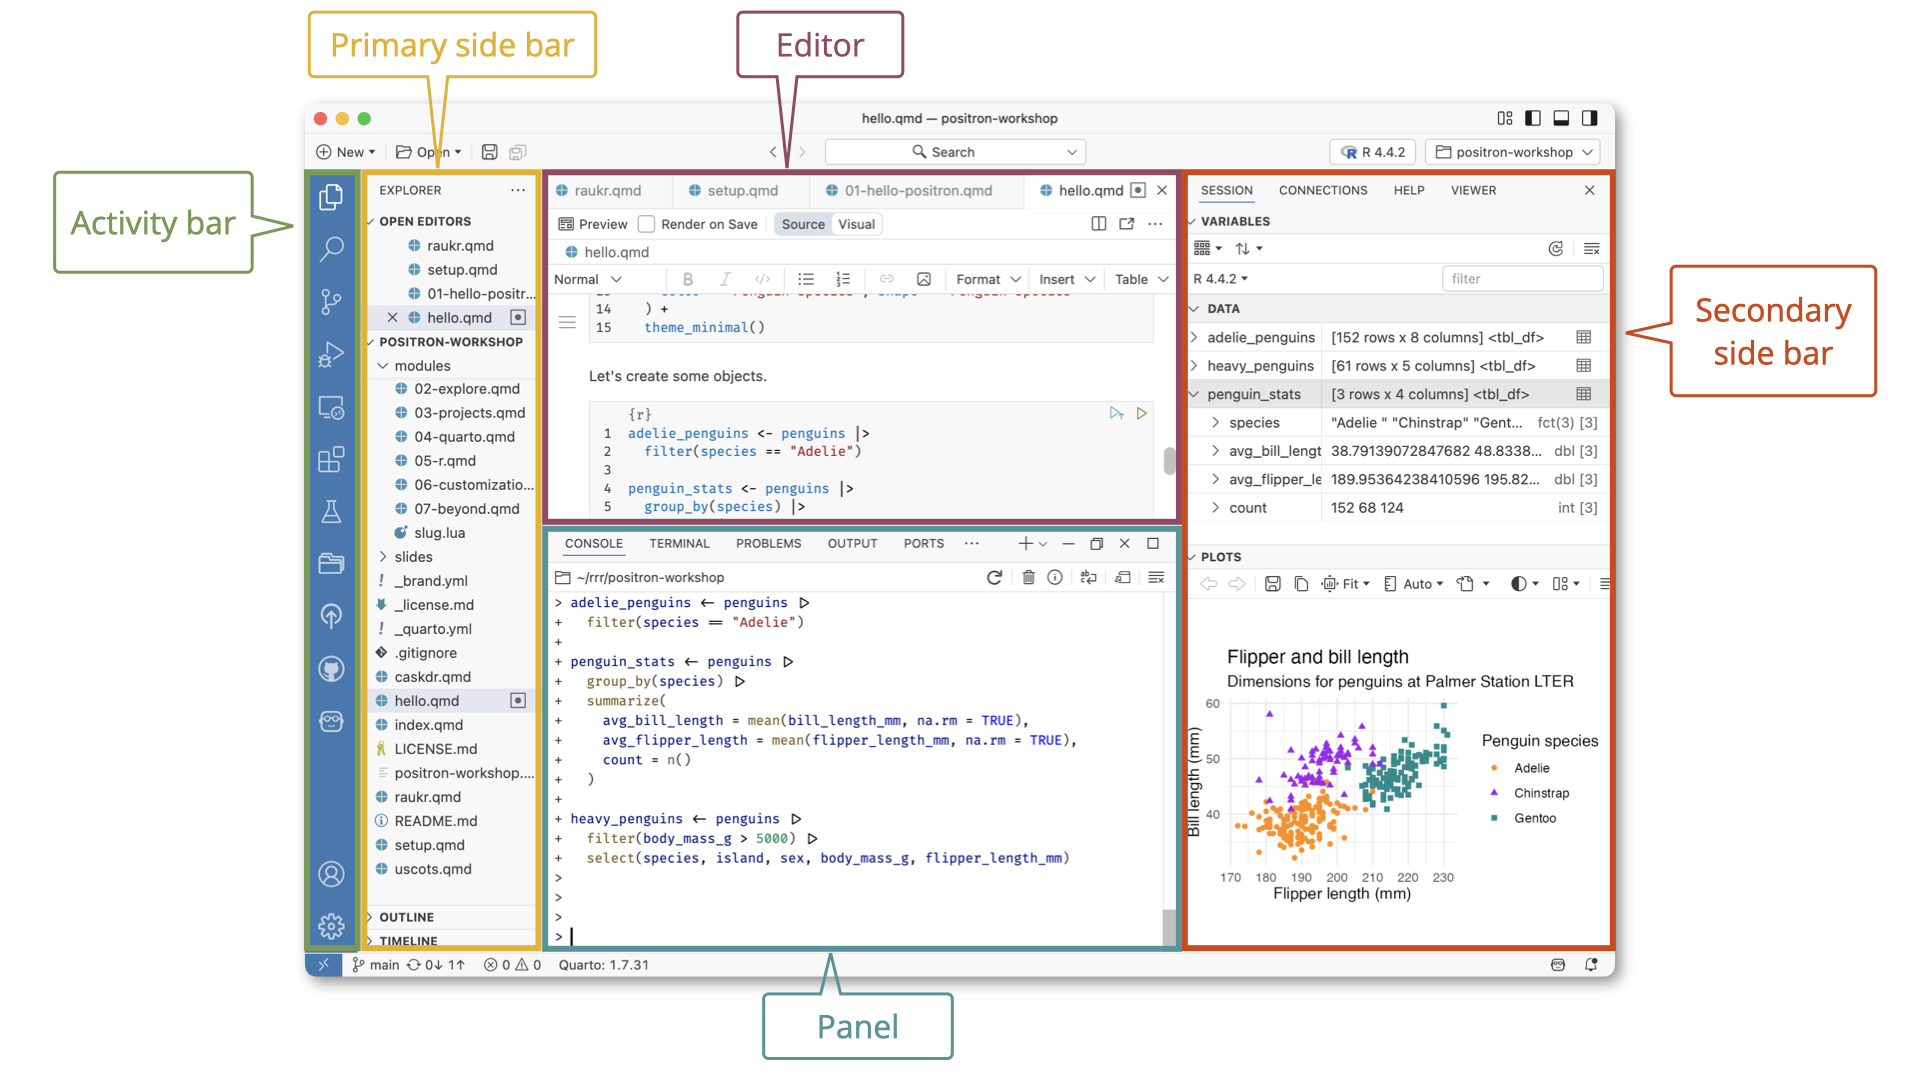
Positron Orientation
Open intro-to-R.R file and follow along
Staying organized
1) Save your code in .R files
3) Always open your folder from Positron
Your turn
A. Practice getting organized
Make a new folder called week1, then open it in Positron (File > Open Folder… ).
Create a new R script and save it as practice.R.
Open the practice.R file and write your answers to these questions in it.
B. Creating & working with objects
1). Create objects to store the values in this table:
San Francisco, CA
47
884
Chicago, IL
228
2,716
Washington, DC
61
694
Using the objects you created, answer the following questions:
Which city has the highest density?
How many more people would need to live in DC for it to have the same population density as San Francisco?
Installing packages
install.packages("packagename")(The package name must be in quotes)
install.packages ("packagename" ) # This works install.packages (packagename) # This doesn't work
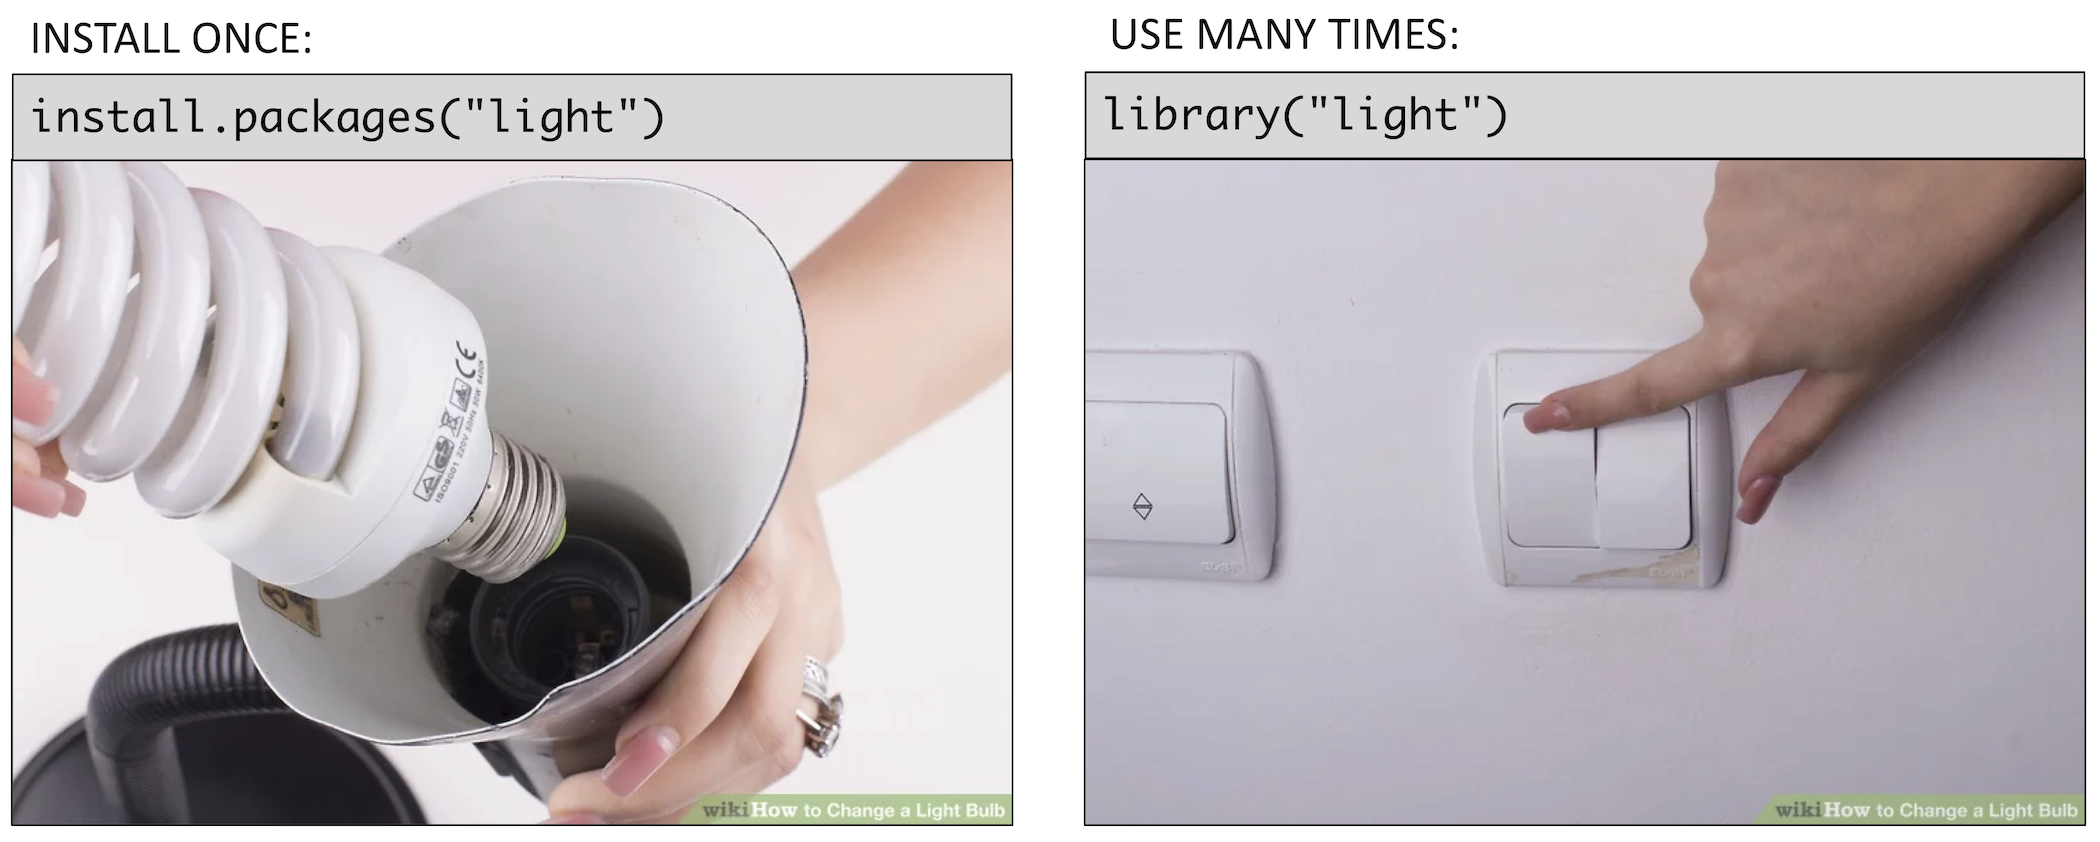
You only need to install a package once!
Loading packages
library(packagename): Loads all the functions in a package(The package name doesn’t need to be in quotes)
library ("packagename" ) # This works library (packagename) # This also works
You need to load the package every time you use it!
Installing vs. Loading
Example: wikifacts
Install the Wikifacts package, by Keith McNulty:
install.packages ("wikifacts" )
Load the package:
library (wikifacts) # Load the library
Use one of the package functions
#> [1] "Did you know that the Romans built a temple possibly dedicated to a boar cult within the prehistoric Chanctonbury Ring hillfort? (Courtesy of Wikipedia)"
Example: wikifacts
Now, restart your R session in Positron: > Session -> Restart R
Try using the package function again:
#> Error in `wiki_randomfact()`:
#> ! could not find function "wiki_randomfact"
Using only some package functions
You don’t always have to load the whole library.
Functions can be accessed with this pattern:
packagename::functionname()
:: wiki_randomfact ()
#> [1] "Here's some news from 05 May 2026. The Antigua and Barbuda Labour Party, led by Prime Minister Gaston Browne (pictured), wins an increased majority in the general election. (Courtesy of Wikipedia)"
Back intro-to-R.R for the rest of class!