
Data Wrangling
EMSE 6035: Marketing Analytics for Design Decisions
John Paul Helveston
September 09, 2026
Quiz 1
Write your name on the quiz!
Rules:
- Work alone; no outside help of any kind is allowed.
- No calculators, no notes, no books, no computers, no phones.

Required Packages (check practice.R file)
Make sure you have these libraries installed:
Remember: you only need to install packages once!
Week 3: Data Wrangling
1. Working with data frames
2. Data wrangling with the tidyverse
3. Project proposals
Week 3: Data Wrangling
1. Working with data frames
2. Data wrangling with the tidyverse
3. Project proposals
The data frame…in Excel
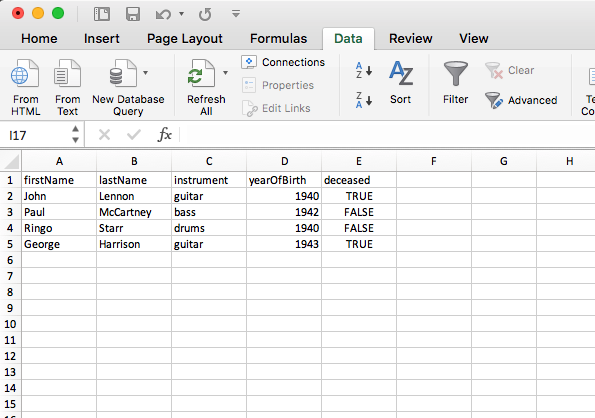
The data frame…in R
#> # A tibble: 4 × 5
#>   firstName lastName  instrument yearOfBirth deceased
#>   <chr>     <chr>     <chr>            <dbl> <lgl>
#> 1 John      Lennon    guitar            1940 TRUE
#> 2 Paul      McCartney bass              1942 FALSE
#> 3 Ringo     Starr     drums             1940 FALSE
#> 4 George Harrison guitar 1943 TRUEColumns: Vectors of values (must be same data type)
#> # A tibble: 4 × 5
#>   firstName lastName  instrument yearOfBirth deceased
#>   <chr>     <chr>     <chr>            <dbl> <lgl>
#> 1 John      Lennon    guitar            1940 TRUE
#> 2 Paul      McCartney bass              1942 FALSE
#> 3 Ringo     Starr     drums             1940 FALSE
#> 4 George Harrison guitar 1943 TRUERows: Information about individual observations
Information about John Lennon is in the first row:
#> # A tibble: 1 × 5
#>   firstName lastName instrument yearOfBirth deceased
#>   <chr>     <chr>    <chr>            <dbl> <lgl>
#> 1 John Lennon guitar 1940 TRUETake a look at the beatles data frame in practice.R
Getting data into R
1. Load external packages
2. Read in external files (usually a .csv file)
CSV = Comma-Separated Values
Data from an R package
Back to practice.R
Importing an external data file
Note the data.csv file in your data folder.
- DO NOT double-click it!
- DO NOT open it in Excel!
Excel can corrupt your data!
(Don’t believe me? Read this paper)
If you must open it in Excel:
- Make a copy
- Open the copy
Steps to importing external data files
1. Create a path to the data
Using file.path() to make file paths
Your paths start from the folder you opened in Positron
(File › Open Folder… - not double-clicking a file!)
Avoid hard-coding file paths!
(they break on every computer but yours)
💩💩💩
Back to reading in data
Important: Use read_csv() instead of read.csv()
Your turn
Use the
file.path()andread_csv()functions to load thedata.csvfile that is in thedatafolder. Name the data frame objectdata.Use the
dataobject to answer the following questions:
- How many rows and columns are in the data frame?
- What type of data is each column? (Just look, don’t need to type out the answer)
- Preview the different columns - what do you think this data is about? What might one row represent?
- How many unique airports are in the data frame?
- What is the earliest and latest observation in the data frame?
- What is the lowest and highest cost of any one repair in the data frame?
Week 3: Data Wrangling
1. Working with data frames
2. Data wrangling with the tidyverse
3. Project proposals
The tidyverse: stringr + dplyr + readr + ggplot2 + …
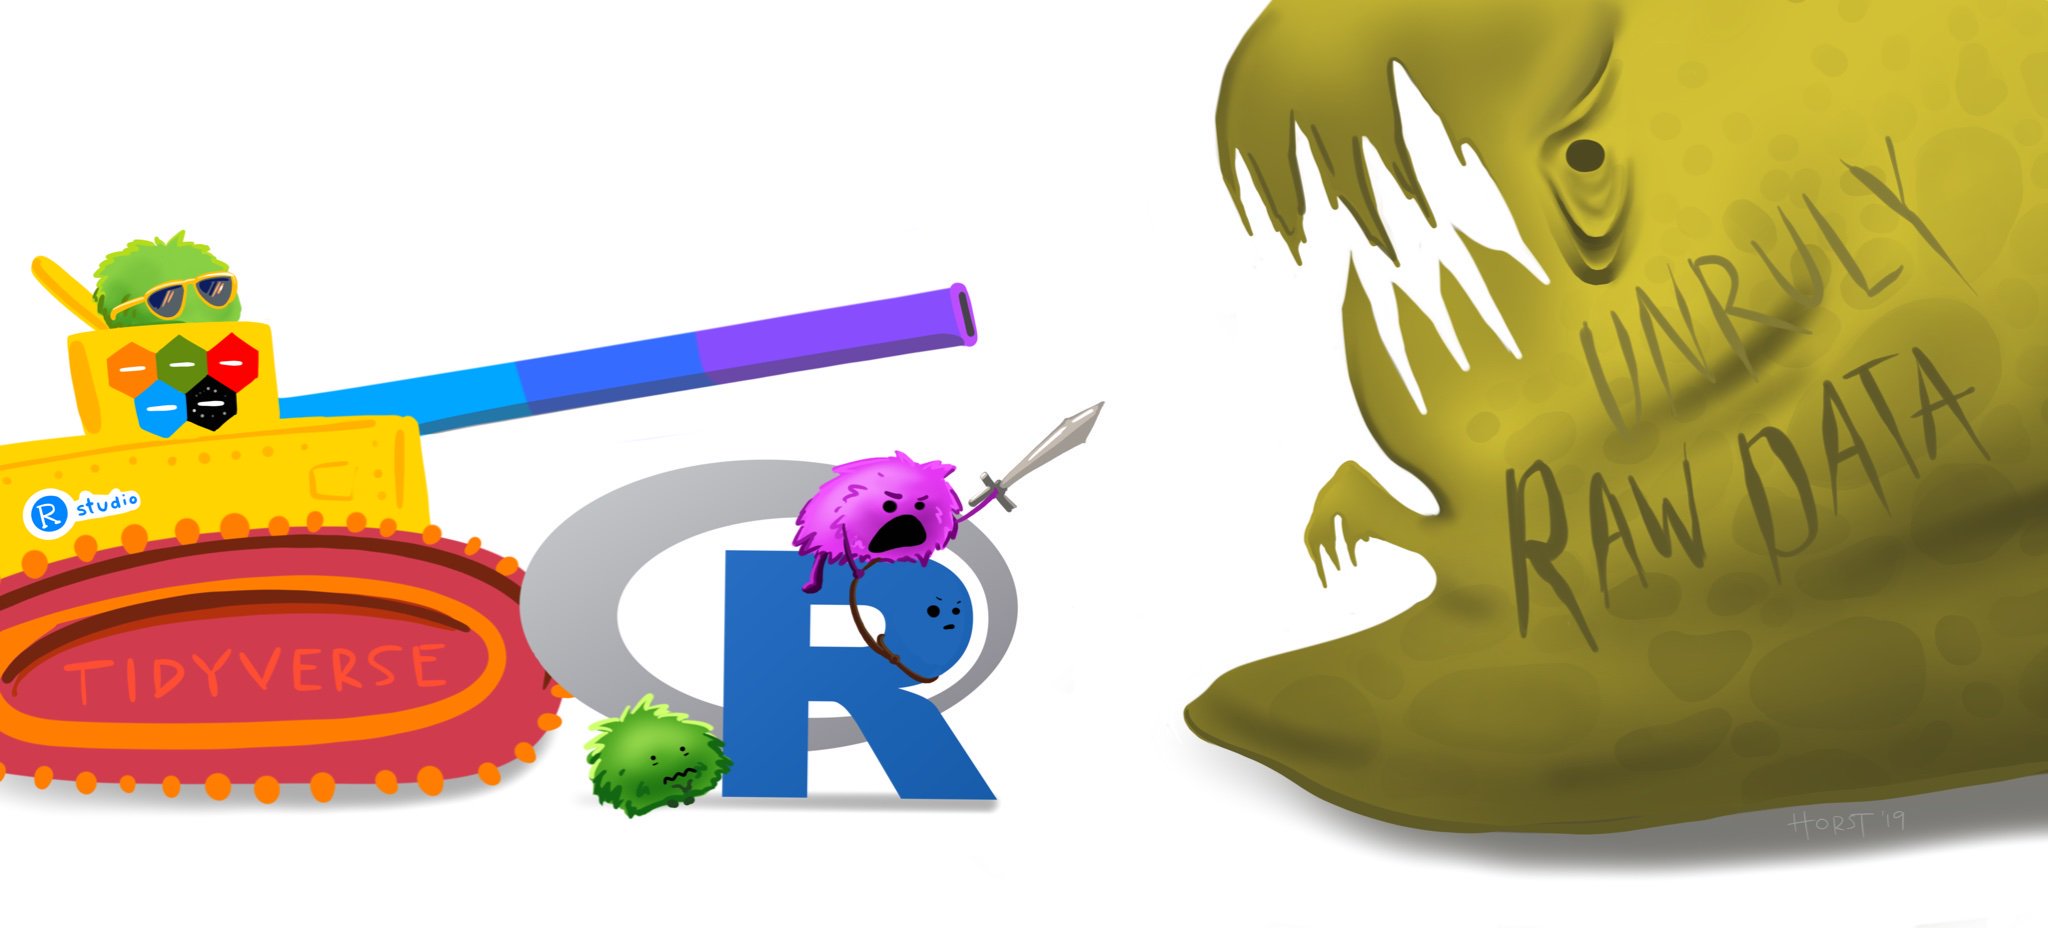
Art by Allison Horst
80% of the job is data wrangling
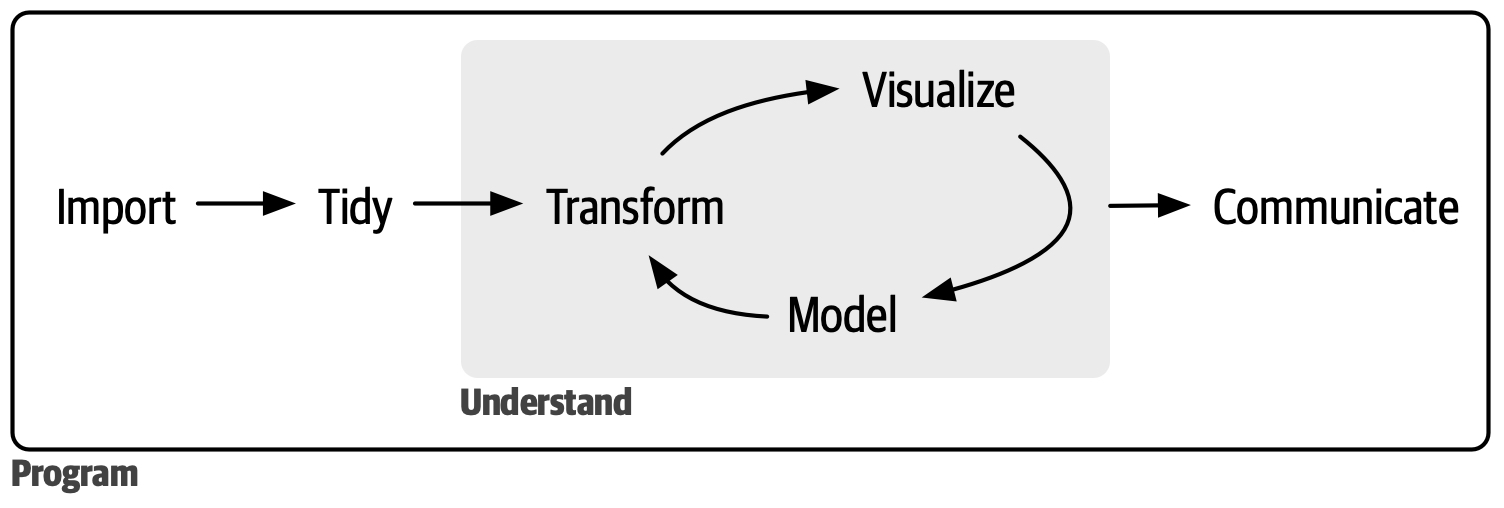
Today: data wrangling with dplyr
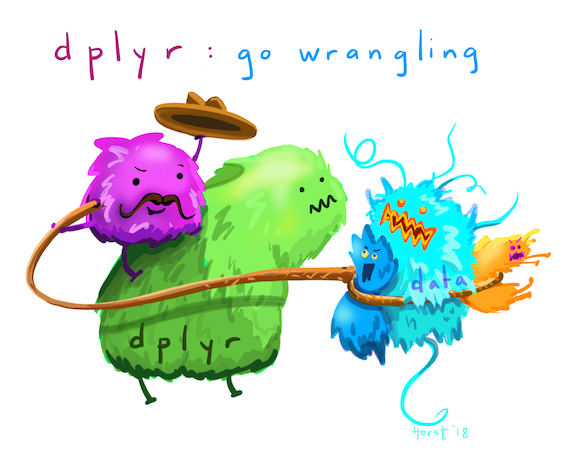
Art by Allison Horst
The main dplyr “verbs”
| “Verb” | What it does |
|---|---|
select() |
Select columns by name |
filter() |
Keep rows that match criteria |
arrange() |
Sort rows based on column(s) |
mutate() |
Create new columns |
summarize() |
Create summary values |
Core tidyverse concept:
Chain functions together with “pipes”
%>%
Think of %>% as the words “…and then…”
Select columns with select()
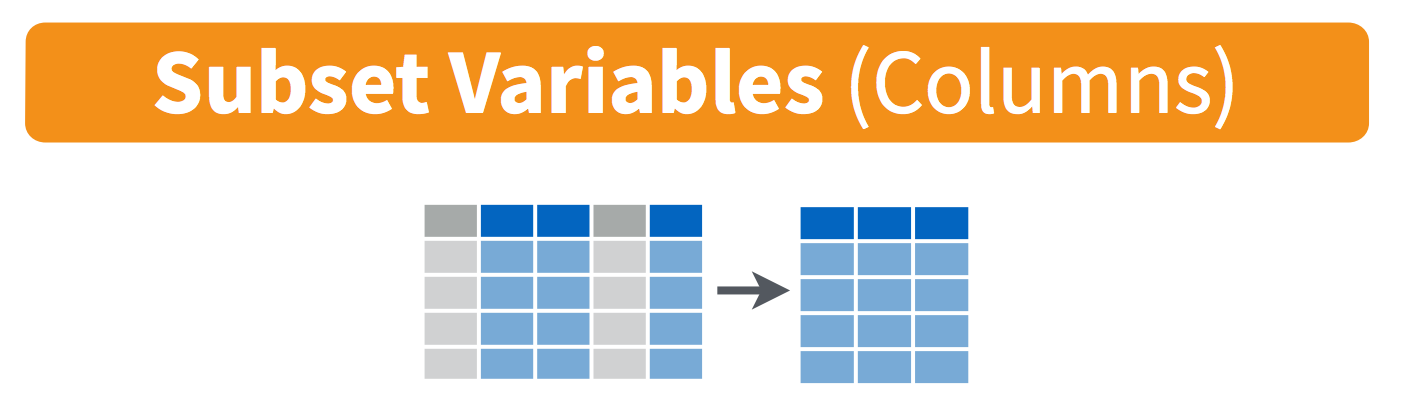
Select columns with select()
#> # A tibble: 4 × 5
#> firstName lastName instrument yearOfBirth deceased
#> <chr> <chr> <chr> <dbl> <lgl>
#> 1 John Lennon guitar 1940 TRUE
#> 2 Paul McCartney bass 1942 FALSE
#> 3 Ringo Starr drums 1940 FALSE
#> 4 George Harrison guitar 1943 TRUESelect columns with select()
Select the columns firstName & lastName
Select columns with select()
Use the - sign to drop columns
Select columns with select()
Select columns based on name criteria:
ends_with()= Select columns that end with a character stringcontains()= Select columns that contain a character stringmatches()= Select columns that match a regular expressionone_of()= Select column names that are from a group of names
Select columns with select()
Select the columns that end with "Name":
Keep specific rows with filter()
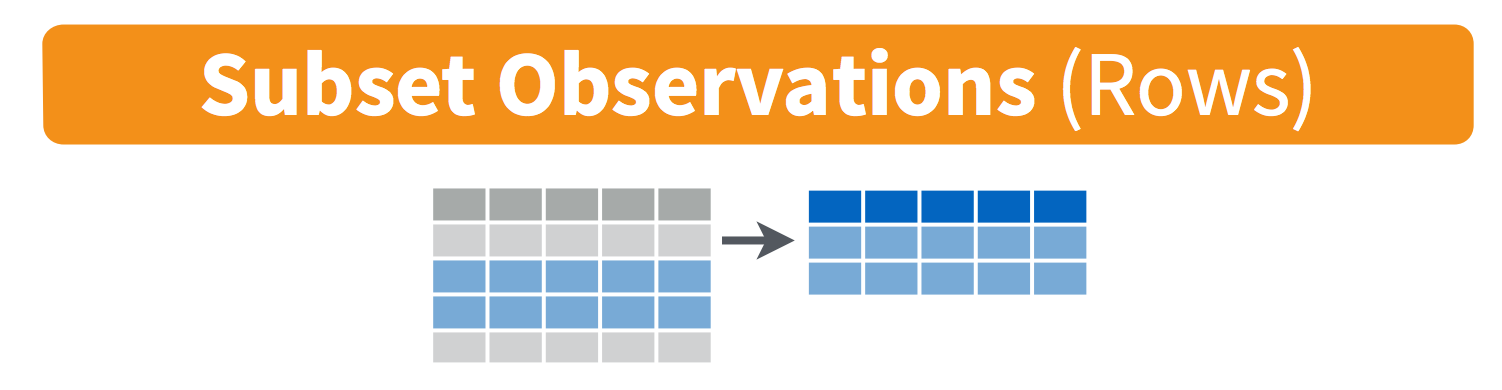
Keep specific rows with filter()
Keep only the rows with band members born after 1941
Keep specific rows with filter()
Keep only the rows with band members born after 1941
Keep specific rows with filter()
Keep only the rows with band members born after 1941 & are still living
#> # A tibble: 1 × 5
#>   firstName lastName  instrument yearOfBirth deceased
#>   <chr>     <chr>     <chr>            <dbl> <lgl>
#> 1 Paul McCartney bass 1942 FALSELogic operators for filter()
| Description | Example |
|---|---|
| Values greater than 1 | value > 1 |
| Values greater than or equal to 1 | value >= 1 |
| Values less than 1 | value < 1 |
| Values less than or equal to 1 | value <= 1 |
| Values equal to 1 | value == 1 |
| Values not equal to 1 | value != 1 |
| Values in the set c(1, 4) | value %in% c(1, 4) |
Removing missing values
Drop all rows where variable is NA
Combine filter() and select()
Get the first & last name of members born after 1941 & are still living
Your turn
Use the
file.path()andread_csv()functions to load thedata.csvfile that is in thedatafolder. Name the data frame objectdata.Use the
dataobject and theselect()andfilter()functions to answer the following questions:
- Create a new data frame,
dc, that contains only the rows from DC airports. - Create a new data frame,
dc_dawn, that contains only the rows from DC airports that occurred at dawn. - Create a new data frame,
dc_dawn_birds, that contains only the rows from DC airports that occurred at dawn and only the columns about the species of bird. - How many unique species of birds have been involved in accidents at DC airports?
Create new variables with mutate()
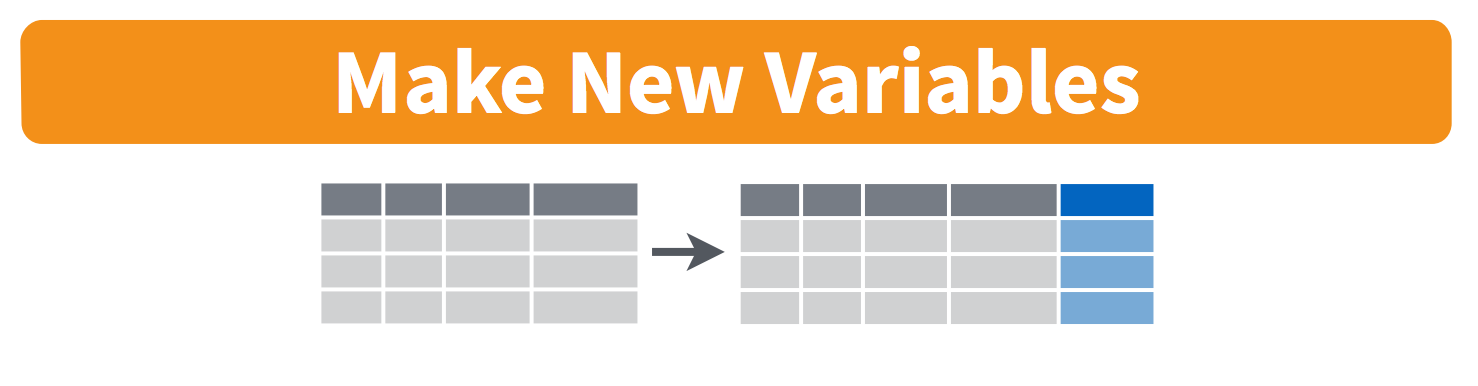
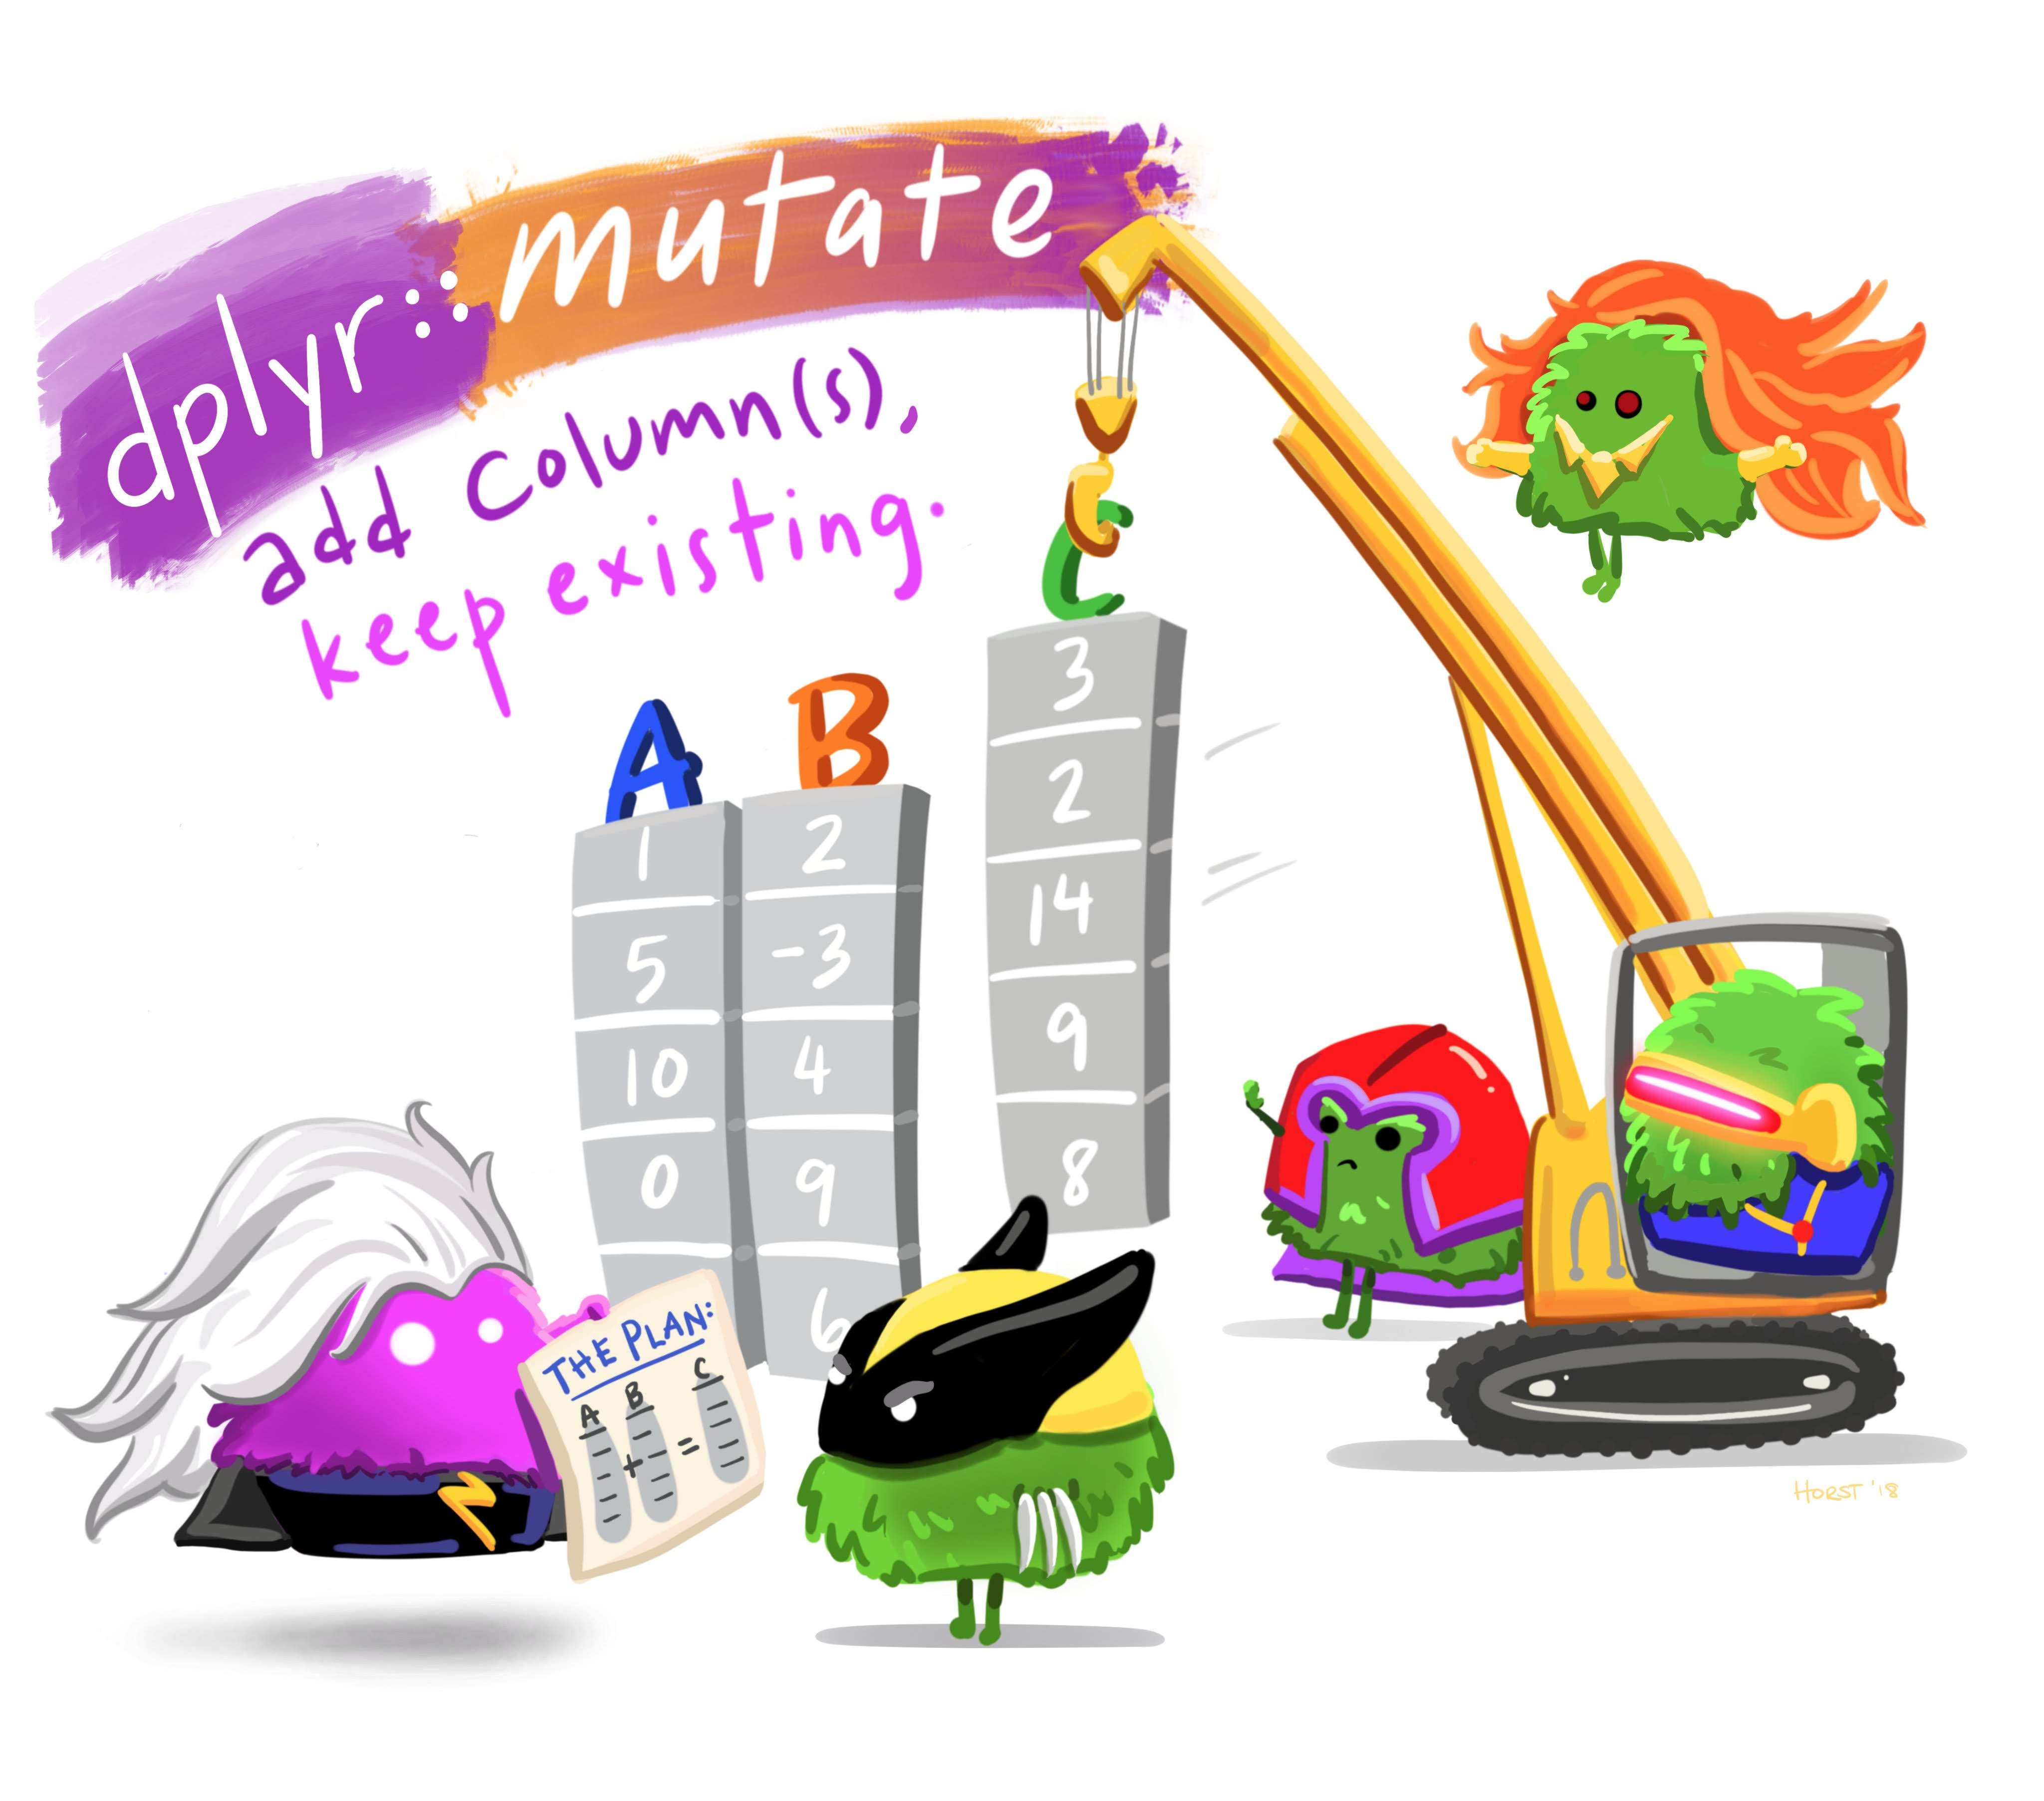
Art by Allison Horst
Create new variables with mutate()
Use the yearOfBirth variable to compute the age of each band member
#> # A tibble: 4 × 6
#>   firstName lastName  instrument yearOfBirth deceased   age
#>   <chr>     <chr>     <chr>            <dbl> <lgl>    <dbl>
#> 1 John      Lennon    guitar            1940 TRUE        82
#> 2 Paul      McCartney bass              1942 FALSE       80
#> 3 Ringo     Starr     drums             1940 FALSE       82
#> 4 George    Harrison  guitar            1943 TRUE        79
You can immediately use new variables
#> # A tibble: 4 × 7
#>   firstName lastName  instrument yearOfBirth deceased   age meanAge
#>   <chr>     <chr>     <chr>            <dbl> <lgl>    <dbl>   <dbl>
#> 1 John      Lennon    guitar            1940 TRUE        82    80.8
#> 2 Paul      McCartney bass              1942 FALSE       80    80.8
#> 3 Ringo     Starr     drums             1940 FALSE       82    80.8
#> 4 George    Harrison  guitar            1943 TRUE        79    80.8
Handling if/else conditions
ifelse(<condition>, <if TRUE>, <else>)
#> # A tibble: 4 × 6
#>   firstName lastName  instrument yearOfBirth deceased playsGuitar
#>   <chr>     <chr>     <chr>            <dbl> <lgl>          <dbl>
#> 1 John      Lennon    guitar            1940 TRUE               1
#> 2 Paul      McCartney bass              1942 FALSE              0
#> 3 Ringo     Starr     drums             1940 FALSE              0
#> 4 George    Harrison  guitar            1943 TRUE               1
Sort data frame with arrange()
Sort beatles data frame by year of birth
Sort data frame with arrange()
Use the desc() function to sort in descending order
Sort rows with arrange()
Compute the band member age, then sort based on the youngest:
#> # A tibble: 4 × 6
#>   firstName lastName  instrument yearOfBirth deceased   age
#>   <chr>     <chr>     <chr>            <dbl> <lgl>    <dbl>
#> 1 George    Harrison  guitar            1943 TRUE        79
#> 2 Paul      McCartney bass              1942 FALSE       80
#> 3 John      Lennon    guitar            1940 TRUE        82
#> 4 Ringo     Starr     drums             1940 FALSE       82
Your turn
Use the
file.path()andread_csv()functions to load thedata.csvfile that is in thedatafolder. Name the data frame objectdata.Using the
dataobject, create the following new variables:
height_miles: Theheightvariable converted to miles (Hint: there are 5,280 feet in a mile).cost_mil: IsTRUEif the repair costs was greater or equal to $1 million,FALSEotherwise.
- Remove rows that have
NAforcost_repairs_infl_adjand re-arrange the resulting data frame based on the highest height and most expensive cost
Break
Week 3: Data Wrangling
1. Working with data frames
2. Data wrangling with the tidyverse
3. Project proposals
Project Proposal Guidelines
Proposal Items
| Item | Description |
|---|---|
| Abstract | Product / technology in just a few sentences |
| Introduction | Description, picture, background |
| Market Opportunity | Identify your customer, competitors, and market size |
| Product Attributes | 2-4 key variables related to product’s design and performance |
| Research Questions | 2-4 research questions you hope to answer about your product |
| Questions | Major outstanding questions to be resolved |
Today
Market Opportunity
- Identify customer
- Identify competitors
- Identify market size
Product Attributes
Features your customer cares about
Research Questions
Decisions you are trying to inform
Example: Folding solar panels
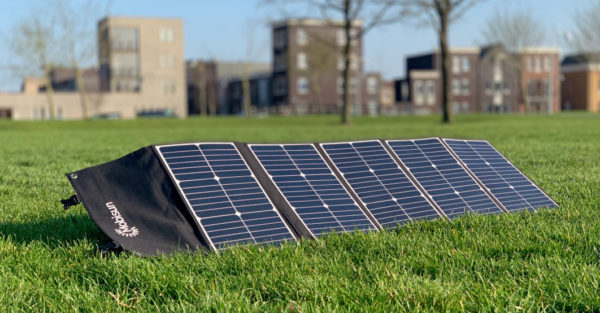
Who is your customer?
- General public?
- Outdoor enthusiasts?
- Emergency gear?
Competitors?
- Similar folding panels
- Batteries?
Example: Electric vehicle battery
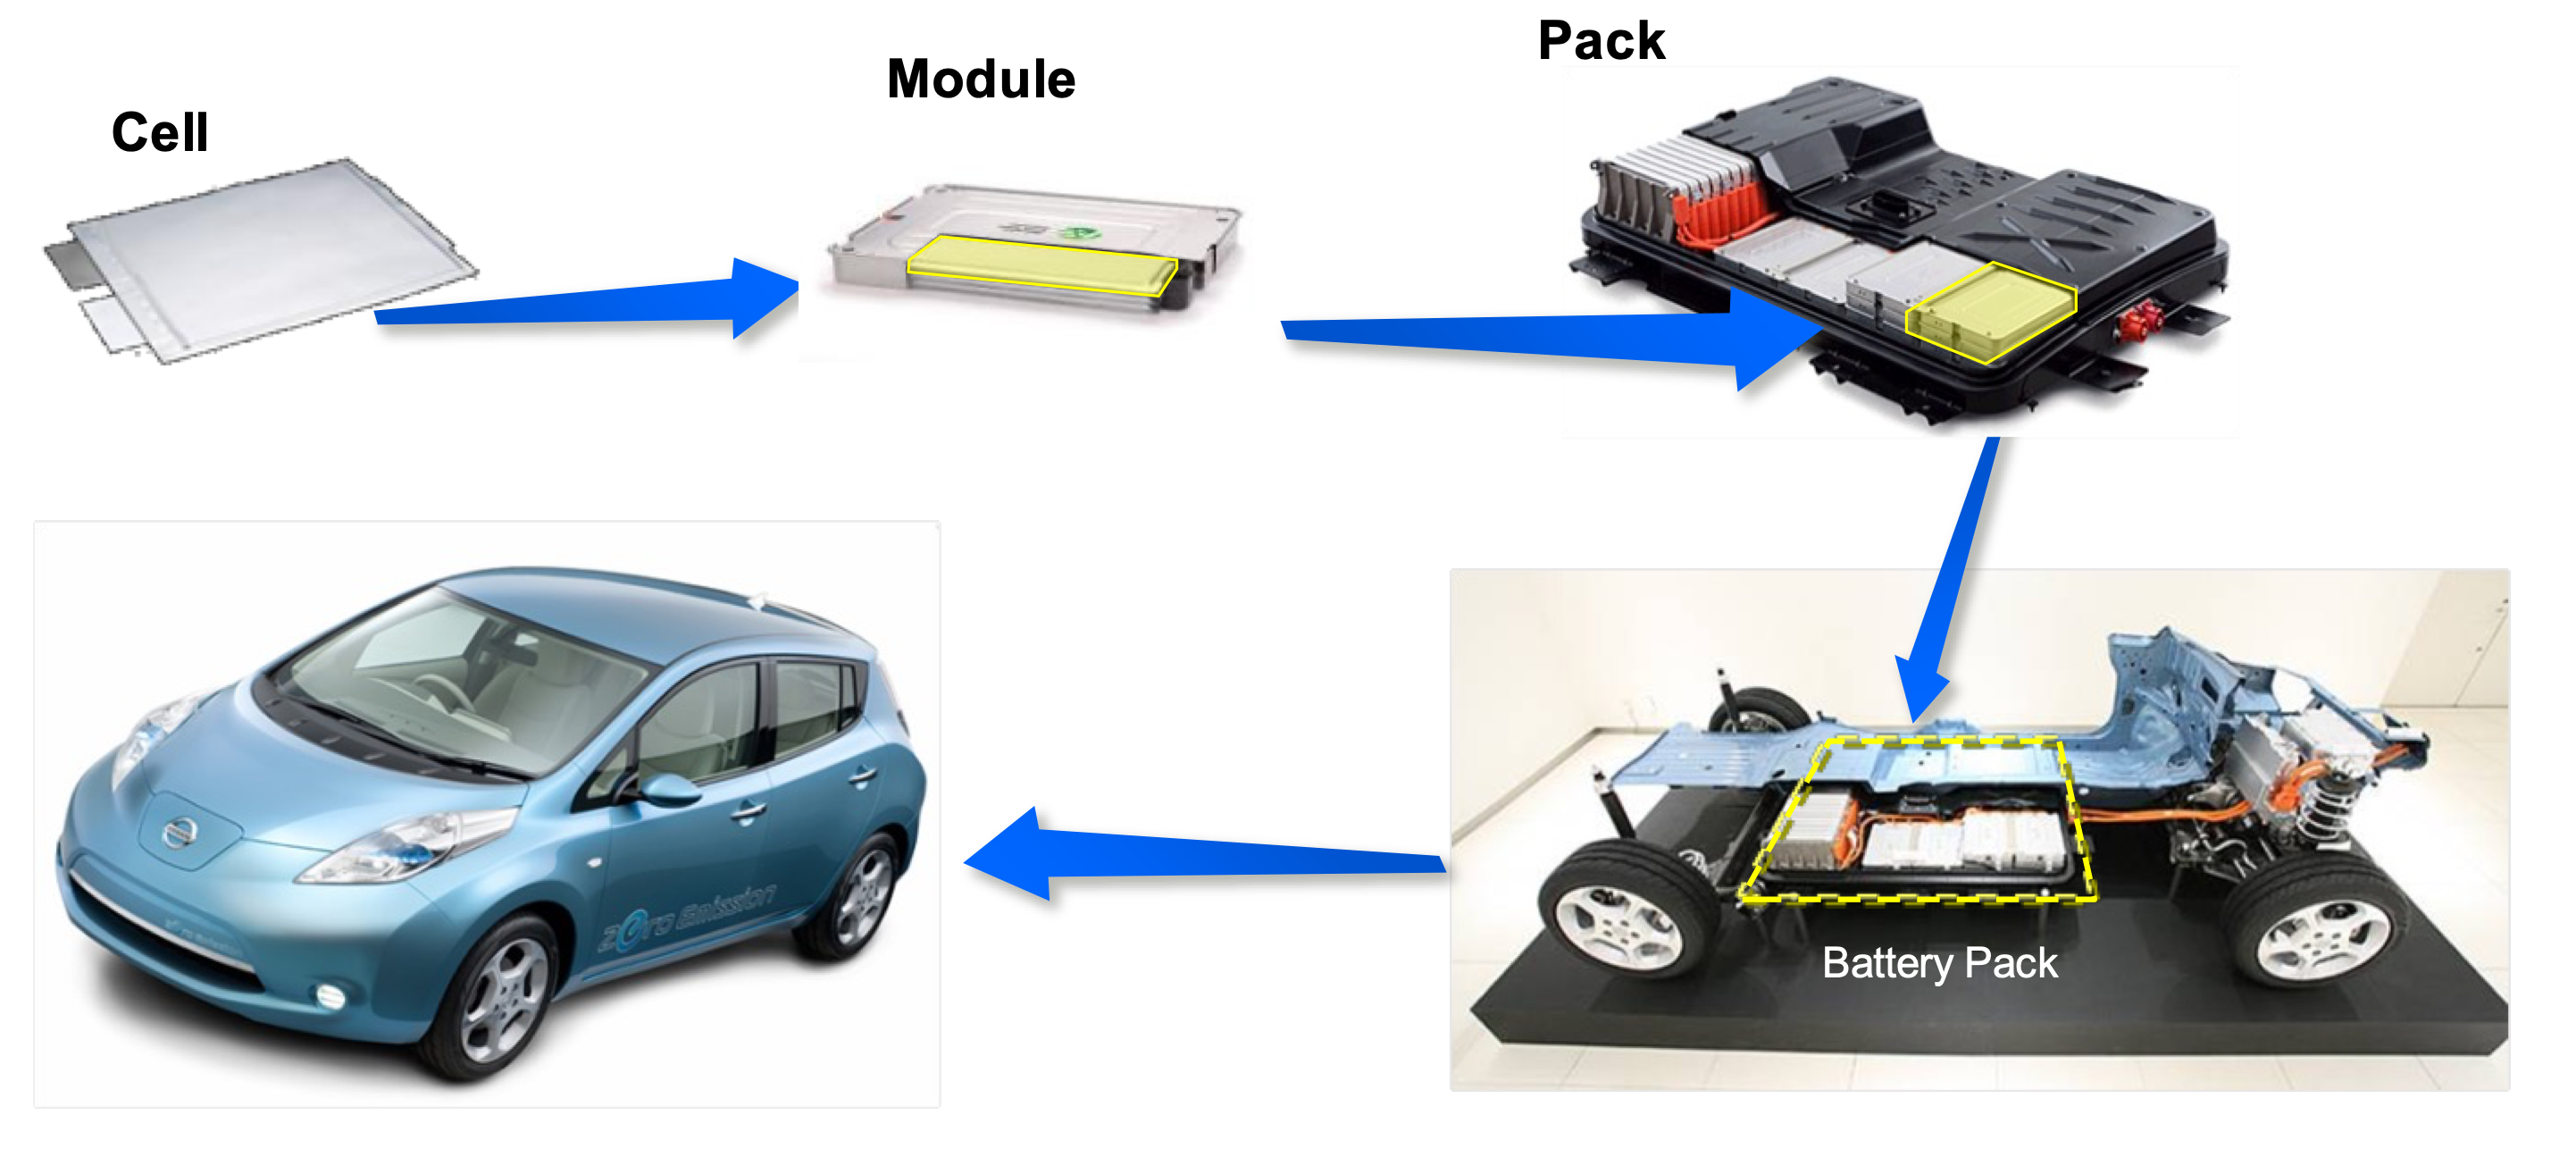
Who is your customer?
- Car buyers
Competitors?
- Hybrid vehicles?
- Efficient gasoline vehicles?
Product Attributes
Features your customer cares about
Research Questions
Decisions you are trying to inform
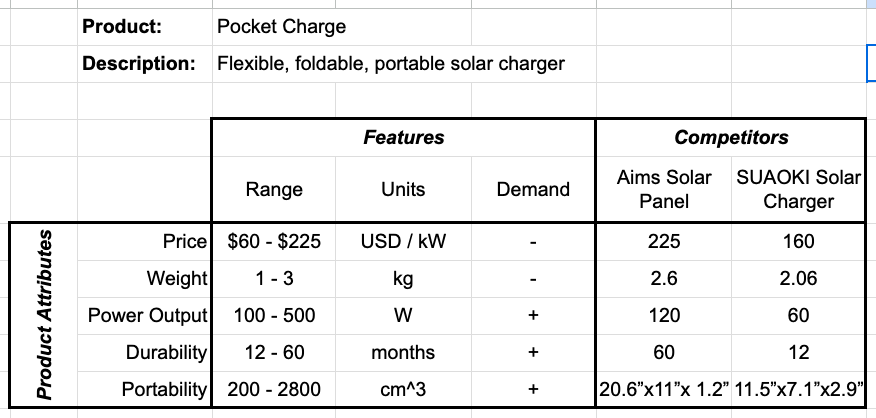
Product Attributes Table (example)
Team Proposals
- Sit with your team
- Discuss & identify your customer & potential competitors
- Discuss & identify key Product Attributes & Research Questions
- Start building out your model relationships table (copy from this example)
Suggestions
- You may want to start with simple bullet lists
- Start with more items rather than fewer (can always cut back later)
Sign up here for your team proposal 1-on-1 with Prof. Helveston