Final Analysis: Lab-Grown Chicken Consumer Preferences
Exploring Environmental and Animal-Welfare Trade-Offs
Author
Luis Bracho, Massimo Mariani, Shannon Zhang, SamiGebeyehu
Published
December 7, 2025
Abstract
Lab-grown chicken is produced from animal cells in a controlled environment rather than by raising and slaughtering animals, and is frequently promoted for its potential environmental and animal-welfare benefits. This project uses a choice-based conjoint experiment to examine how consumers evaluate lab-grown chicken relative to conventional chicken when both are presented side by side with varying product features. The survey introduced respondents to key product attributes: price, cage-free labeling, and reductions in greenhouse gas emissions, water use, and land use, and asked them to complete six two-alternative choice tasks reflecting distinct attribute combinations. After cleaning the data to remove incomplete, invalid, and extremely fast responses, we estimated multinomial and mixed logit models to understand the relative importance of each attribute and to explore heterogeneity across respondent groups. The results show strong price sensitivity, consistent positive preferences for environmental impact reductions and cage-free labeling, and a residual preference for conventional chicken over the lab-grown option. These findings suggest that while sustainability and welfare improvements meaningfully increase product appeal, price remains a central determinant of choice, and consumer hesitancy toward lab-grown chicken persists. Based on these insights, we offer preliminary recommendations on how emerging lab-grown chicken products might be positioned and labeled to improve acceptance and guide future product design decisions.
Introduction
Lab-grown chicken, also known as cultivated, cultured, or cell-based chicken, is real chicken meat grown from isolated animal cells in bioreactors rather than through conventional poultry production. The process begins with extracting a small sample of stem or muscle cells from a chicken, nurturing those cells in a nutrient-rich growth medium, and then allowing them to multiply and differentiate within a controlled environment until they form edible tissue. Once harvested, the tissue can be structured and processed into products intended to replicate the taste, texture, and nutritional qualities of traditional chicken. Companies such as UPSIDE Foods and GOOD Meat have advanced this technology in recent years, focusing on improving cost efficiency, scaling production, enhancing food safety, and securing regulatory approval.
The motivation for studying consumer preferences around lab-grown chicken stems from both environmental and ethical considerations. Conventional chicken farming contributes to greenhouse gas emissions, freshwater consumption, land use, fertilizer management challenges, and animal-welfare concerns associated with confinement and slaughter. Lab-grown chicken has the potential to reduce several of these impacts, positioning it as a promising alternative for environmentally conscious consumers. However, despite its potential, public acceptance remains uncertain. Many consumers express curiosity and openness, while others worry about unfamiliarity, safety, or perceived unnaturalness. These mixed attitudes create uncertainty about how lab-grown chicken products should be positioned in a retail environment and which product features are most essential for consumer adoption.
To address these questions, we designed and administered a choice-based conjoint (CBC) survey that presented respondents with repeated choices between hypothetical chicken products varying in price, production method, environmental sustainability metrics, and cage-free labeling. The aim of this study was to quantify how consumers value each of these attributes and to identify whether respondents show an inherent preference for or against lab-grown chicken when controlling for other features. The results provide insight into the market potential of lab-grown chicken and inform product design decisions such as pricing, packaging claims, and environmental disclosures.
Figure 1: Cultivated meat production process (source: Animal Welfare Worldwide)
Survey Design
The survey was designed to capture realistic consumer decision-making while ensuring that only eligible and engaged respondents were included in the analysis. At the beginning of the survey, respondents confirmed that they consumed chicken, that they were at least eighteen years old, and that they were willing to consider trying lab-grown chicken; those who did not meet these conditions were screened out. Additional demographic information was collected, including age, household income, dietary preferences, and whether the respondent lived in an urban, suburban, or rural area. Respondents also answered questions about their familiarity with lab-grown meat and provided brief reflections on factors they consider important when purchasing chicken. This information allowed us to characterize the sample and explore potential differences in preferences across groups.
Before beginning the choice tasks, respondents viewed an educational page explaining how to interpret the product attributes. This page introduced the concept of lab-grown chicken, clarified that environmental attributes (greenhouse gas emissions, water use, and land use) were expressed as percentage reductions relative to conventional chicken, and explained why lab-grown chicken does not receive a cage-free label. The purpose of this explanation was to ensure that all respondents understood the meaning of each attribute and could make informed decisions during the choice tasks.
The core of the survey consisted of six two-alternative conjoint choice questions. Each question presented respondents with two hypothetical chicken products constructed from a predefined set of attribute levels specified in our experimental design file. The attributes included price, production type (conventional or lab-grown), cage-free labeling, and reductions in greenhouse gas emissions, water use, and land use.
Code
library(tibble)library(knitr)library(kableExtra)attribute_table <-tribble(~Attribute, ~Levels, ~Description,"Price", "$2, $4, $6", "Cost of the chicken product in each choice task (dollars per pound).","Production Type", "Labgrownmeat, Chickenmeat", "Indicates whether the product is lab-grown or conventional chicken.","Cage-free Label", "Yes, No", "Indicates whether the product carries a cage-free certification.","GHG Reduction", "75%, 50%, 25%, 0%", "Percent reduction in greenhouse gas emissions relative to conventional chicken.","Water-use Reduction", "75%, 50%, 25%, 0%", "Percent reduction in water use relative to conventional chicken.","Land-use Reduction", "75%, 50%, 25%, 0%", "Percent reduction in land use relative to conventional chicken.")attribute_table %>%kable("html",caption ="Table 1. Attributes and Levels Used in the Conjoint Design",booktabs =TRUE,escape =FALSE) %>%kable_styling(full_width =FALSE,bootstrap_options =c("striped", "hover", "condensed"),position ="center") %>%column_spec(1, bold =TRUE, width ="5cm") %>%column_spec(2, width ="4cm") %>%column_spec(3, width ="9cm") %>%row_spec(0, bold =TRUE)
Table 1. Attributes and Levels Used in the Conjoint Design
Attribute
Levels
Description
Price
$2, $4, $6
Cost of the chicken product in each choice task (dollars per pound).
Production Type
Labgrownmeat, Chickenmeat
Indicates whether the product is lab-grown or conventional chicken.
Cage-free Label
Yes, No
Indicates whether the product carries a cage-free certification.
GHG Reduction
75%, 50%, 25%, 0%
Percent reduction in greenhouse gas emissions relative to conventional chicken.
Water-use Reduction
75%, 50%, 25%, 0%
Percent reduction in water use relative to conventional chicken.
Land-use Reduction
75%, 50%, 25%, 0%
Percent reduction in land use relative to conventional chicken.
Changes from Pilot to Final Survey
Several modifications were made between the pilot survey and the final version to improve data quality and model identifiability. In the pilot design, sustainability attributes were highly restricted: lab-grown chicken always appeared with large environmental reductions, while conventional chicken always appeared with 0% reductions. This made the profiles appear realistic but created strong correlations between production type and sustainability, preventing us from separately estimating their effects. In the final survey, we relaxed these restrictions by allowing a broader distribution of environmental reduction levels across both product types, increasing attribute variation and reducing multicollinearity. We also replaced a free-text ranking question with multiple-choice items to reduce missing data and improve consistency. In addition, the educational page was expanded to provide a clearer explanation of why lab-grown chicken does not receive a cage-free label, addressing confusion observed in pilot responses. These refinements were implemented to enhance survey clarity, reduce respondent burden, and produce a more statistically efficient experimental design.
The survey randomly assigned combinations of these attribute levels using a balanced design to ensure sufficient variation for model estimation. After data collection, we applied data-cleaning procedures: incomplete responses were removed and extremely fast respondents were filtered out to preserve data quality. The final long-format dataset was constructed by merging responses with the experimental design, generating unique respondent and observation identifiers, and coding the chosen alternative as a binary outcome for logit modeling.
Figure 2: Example of a choice question shown to respondents.
Data Analysis
Semple Description
A total of 250 individuals started the survey. After applying the planned screening and data-quality filters (removing screened-out participants, incomplete responses, straight-liners, and respondents with unrealistically short completion times), the final analytical sample included 163 valid respondents, providing 1,956 total choice observations across six choice tasks per person (two alternatives per task).
Respondents varied across demographic and attitudinal questions. For example, the survey collected information on familiarity with lab-grown chicken, age, income, dietary preferences, and geographic location. These variables allow us to examine potential heterogeneity in consumer preferences and segment the sample for subgroup analyses.
Data Cleaning
We first imported the raw response data from the survey database and removed respondents who failed key screening criteria. Specifically, we dropped participants who did not consent, were screened out for unwillingness to try lab-grown meat, or did not finish all six conjoint choice questions.We also removed respondents who selected the same option across all choice tasks and those who completed the survey unusually fast (less than 0.1 minutes), which indicated potentially low-quality responses.
After filtering, additional demographic and timing variables were retained, and the choice data was reshaped into long format by pivoting the six choice questions. We joined the survey design file to each observation, converted the selected alternative into a binary choice variable (1 = chosen), and constructed respID and obsID identifiers for use in logit estimation.
The result is a long-format file containing 978 valid choice observations that were used in all modeling and analysis.
Modeling
Baseline Logit Model
We estimated a multinomial logit (MNL) model in preference space based on the six attributes included in the choice experiment: price (continuous), GHG emissions reduction, water use reduction, land use reduction (continuous environmental performance attributes), and two binary variables indicating lab-grown meat and cage-free production (with chicken meat and non-cage-free serving as reference categories).
The baseline utility specification for alternative j in choice occasion t for individual i is:
\[U_{ijt} =\beta_{price}\, price_{ijt} +\beta_{ghg}\, ghg\_reduction_{ijt} +\beta_{water}\, wateruse\_reduction_{ijt} +\beta_{land}\, landuse\_reduction_{ijt} +\beta_{lab}\, type\_Labgrownmeat_{ijt} +\beta_{cagefree}\, cagefree\_Yes_{ijt}+ \varepsilon_{ijt}\] As expected, the estimated model indicates a negative and statistically significant coefficient on price, while cage-free production yields a positive and statistically significant effect on utility. Environmental attributes display positive signs but are not statistically significant in this sample.
Figure 3: Summary table of utility coefficient estimates with standard errors
Results
Willingness to Pay Results
Using the choice data on chicken products, a multinomial logit model was estimated with attributes for price, greenhouse gas (GHG) reduction, water use reduction, land use reduction, production type (lab‑grown vs conventional), and cage‑free status. Price entered linearly, environmental attributes were coded as continuous percentage reductions from 0% to 75%, and type and cage‑free were dummy variables.
Marginal willingness to pay (WTP) was obtained by dividing each attribute’s coefficient by the negative of the price coefficient, converting utilities to dollars per unit change. For the environmental attributes, WTP can be interpreted as the extra amount respondents are willing to pay per one‑percentage‑point improvement in GHG, water, or land‑use reduction; for the categorical attributes, WTP represents the premium for lab‑grown over conventional and for cage‑free over not cage‑free.
The illustrative results suggest that respondents place the highest WTP on GHG reductions and on lab‑grown and cage‑free status, with somewhat smaller but still positive WTP for water and land‑use reductions. Moving from 0% to 50% GHG reduction corresponds to roughly a dollar‑plus premium per pack, while switching from conventional to lab‑grown chicken and adding a cage‑free label each adds a sizable premium of several dozen cents. Plots of mean WTP with 95% confidence intervals across the 0–75% range show that GHG reductions are consistently most valued, followed by water, while land‑use reductions are valued but with greater uncertainty.
Market Simulation
To translate these preferences into market outcomes, market simulations compared a focal lab‑grown product to two conventional competitors. In a baseline scenario, the focal product is lab‑grown, cage‑free, and offers 50% reductions in GHG, water, and land use at a price of 4 USD. One competitor is conventional, not cage‑free, with 25% reductions at 3 USD, and the other is conventional, not cage‑free, with 0% reductions at 2 USD.
Under this scenario, the simulated choice probabilities indicate that the lab‑grown product captures roughly half the market despite being the most expensive option, while the moderately improved conventional product captures about one‑third and the cheapest, non‑improved option the remainder. When the price of the lab‑grown product is varied from 2 to 6 USD, holding all other attributes fixed, its simulated share falls smoothly from a large majority at 2 USD to well under one‑quarter at 6 USD. A corresponding revenue curve peaks around 4–5 USD, suggesting that pricing in this mid‑range balances a strong market share with high revenue potential.
Sensitivity and Tornado Analysis
A sensitivity analysis was conducted around the baseline by perturbing each attribute of the lab‑grown product while holding competitors fixed. Price was shifted from 4 USD to 3 and 5 USD; GHG, water, and land reductions were each moved from 50% down to 25% and up to 75%; and lab‑grown and cage‑free were toggled to their conventional and non‑cage‑free counterparts. For each case, simulated market shares were recomputed and compared with the baseline share.
Market share versus price plots show that price is a dominant driver of demand, with share particularly sensitive to changes around the 4 USD baseline. Overlaying a revenue curve indicates that expected revenue is highest in a band roughly between 4 and 5 USD, after which further price increases reduce revenue as share drops more steeply. A tornado plot summarizing the high–low cases shows that price has the largest impact on share, followed by GHG reduction, lab‑grown identity, and cage‑free status, with water and land‑use reductions having smaller effects. This pattern suggests that, for lab‑grown chicken, the most powerful levers are price and clear, credible communication of climate and animal‑welfare benefits.
Limitations
These results are based on stated‑preference data rather than observed purchases, so actual market behavior may involve lower WTP and adoption. The survey sample may also over‑represent younger or more sustainability‑oriented consumers, which could bias estimates upward for lab‑grown and environmental attributes. In addition, predictions are most reliable within the attribute ranges used in the experiment (0–75% reductions and prices of 2, 4, and 6 USD); extrapolating beyond these ranges should be done cautiously. Finally, the model does not explicitly capture factors such as taste experience, safety perceptions, branding, or distribution, all of which would matter for real‑world adoption of lab‑grown chicken.
Final Recommendations and Conclusions
Limitations
Attribution
All members contributed equally.
Appendix
Code
library(surveydown)
Welcome! Thank you for taking part in our survey. My team and I are researching consumer preferences for lab-grown chicken meat.
Note
Your responses will help us better understand how people view new food technologies and what factors are most important when making food choices. This survey will take about 5–10 minutes to complete!
Code
sd_next()
Consent
If you would like to participate, please answer the following questions:
Code
sd_question(type ='mc',id ='consent_age',label ="I am age 18 or older",option =c('Yes'='yes','No'='no' ))
*
Code
sd_question(type ='mc',id ='consent_understand',label ="I have read and understand the above information",option =c('Yes'='yes','No'='no' ))
sd_question(type ='mc',id ='us_resident',label ="Are you a resident of the US",option =c('Yes'='yes','No'='no' ))
*
Code
sd_next()
Screening Questions
Code
sd_question(type ='mc',id ='screenout',label ="Before we go on, would you be willing to try lab-grown (cultivated) chicken meat?",option =c('Yes, I would consider it'='yes','No, absoultely not'='no' ))
*
Code
sd_next()
Educational Page
Great work!
To help you answer our questions, here are a few short descriptions of the product features:
Price (dollar/lb): The cost of one pound of lab-grown meat/regular meat (ranges from 2, 4, 6).
Sustainability: Lab-grown meat reduces greenhouse gas emissions, land, and water use. Options include a reduction rate.
Animal Welfare: Some products may carry a certification that they are slaughter-free, while others may not.
Code
sd_next()
Choice-based Conjoint (cbc) Practice
We’ll now begin the choice tasks. On the next few pages we will show you options of chicken meat and we’ll ask you to choose the one you most prefer.
Code
# Define the option vectorchicken_buttons_option <-c("option_1", "option_2")# Change the names of each element to display markdown-formatted# text and an embedded image using htmlnames(chicken_buttons_option)[1] <-" **Option 1**<br> <img src='images/Chickenmeat.png' width=100><br> **Type**: Regular Chicken Meat<br> **Price**: $ 2 / lb<br> **GHG Reduction**: 0<br> **Land-use Reduction**: 0<br> **Water-use Reduction**: 0<br> **Cage Free**: No"names(chicken_buttons_option)[2] <-" **Option 2**<br> <img src='images/Labgrownmeat.png' width=100><br> **Type**: Lab-grown Chicken Meat<br> **Price**: $ 4-6 / lb<br> **GHG Reduction**: 76%<br> **Land-use Reduction**: 92%<br> **Water-use Reduction**: 84%<br> **Cage Free**: Yes"sd_question(type ='mc_buttons',id ='cbc_practice',label ="For example, if these were the only chicken meat options available at the grocery store, which would you choose?",option = chicken_buttons_option)
*
Code
sd_next()
Conjoint Question Intro
Great work!
We will now show you 6 sets of choice questions starting on the next page.
Code
sd_next()
Conjoint Question 1
Code
sd_output("cbc_q1", type ="question")
*
Code
sd_next()
Conjoint Question 2
Code
sd_output("cbc_q2", type ="question")
*
Code
sd_next()
Conjoint Question 3
Code
sd_output("cbc_q3", type ="question")
*
Code
sd_next()
Conjoint Question 4
Code
sd_output("cbc_q4", type ="question")
*
Code
sd_next()
Conjoint Question 5
Code
sd_output("cbc_q5", type ="question")
*
Code
sd_next()
Conjoint Question 6
Code
sd_output("cbc_q6", type ="question")
*
Code
sd_next()
Lab-grown Chicken Meat Knowledge
Thank you for your feedback! The next section will ask some basic questions about lab-grown chicken meat.
Please answer to the best of your knowledge.
Code
sd_question(type ='mc',id ='chicken_knowledge_1',label ='How familiar are you with lab-grown chicken meat before this survey?',option =c('Not at all'='familiarity','Very familiar'='familiarity','kind of'='familiarity' ))
*
Code
sd_question(type ='text',id ='chicken_knowledge_2',label ='Rank the following in order of importance when choosing chicken meat: Price, Sustainability, Animal Welfare' )
*
Code
sd_next()
Demographics Page
Nice job!
We’re almost done! We’d just like to ask just a few more questions about you which we will only use for analyzing our survey data.
Code
# Construct the list of yearssd_question(type ='mc',id ='your_age',label ="What is your age?",option =c('18-24'='age','25-34'='age','35-44'='age','45-54'='age','55+'='age' ))
*
Code
sd_question(type ='mc',id ='income',label ="What is your approximate annual household income?",option =c('Under $25,000'='income','$25,000–50,000'='income','$50,000–75,000'='income','$75,000–100,000'='income','$100,000+'='income' ))
*
Code
sd_question(type ='mc',id ='dietary_preferences',label ="Which best describes your diet?",option =c('Meat eater'='preference','Vegan '='preference','Vegetarian'='preference','Other'='preference' ))
*
Code
sd_question(type ='text',id ='location',label ="Do you currently live in an urban, suburban, or rural area?" )
*
Code
sd_next()
::: {.sd_page id=end_normal}
End Page
The survey is finished. Thank you for your feedback!
Lab-grown chicken is produced from animal cells in a controlled environment rather than by raising and slaughtering animals, and is frequently promoted for its potential environmental and animal-welfare benefits. This project uses a choice-based conjoint experiment to examine how consumers evaluate lab-grown chicken relative to conventional chicken when both are presented side by side with varying product features. The survey introduced respondents to key product attributes: price, cage-free labeling, and reductions in greenhouse gas emissions, water use, and land use, and asked them to complete six two-alternative choice tasks reflecting distinct attribute combinations. After cleaning the data to remove incomplete, invalid, and extremely fast responses, we estimated multinomial and mixed logit models to understand the relative importance of each attribute and to explore heterogeneity across respondent groups. The results show strong price sensitivity, consistent positive preferences for environmental impact reductions and cage-free labeling, and a residual preference for conventional chicken over the lab-grown option. These findings suggest that while sustainability and welfare improvements meaningfully increase product appeal, price remains a central determinant of choice, and consumer hesitancy toward lab-grown chicken persists. Based on these insights, we offer preliminary recommendations on how emerging lab-grown chicken products might be positioned and labeled to improve acceptance and guide future product design decisions.
Introduction
Lab-grown chicken, also known as cultivated, cultured, or cell-based chicken, is real chicken meat grown from isolated animal cells in bioreactors rather than through conventional poultry production. The process begins with extracting a small sample of stem or muscle cells from a chicken, nurturing those cells in a nutrient-rich growth medium, and then allowing them to multiply and differentiate within a controlled environment until they form edible tissue. Once harvested, the tissue can be structured and processed into products intended to replicate the taste, texture, and nutritional qualities of traditional chicken. Companies such as UPSIDE Foods and GOOD Meat have advanced this technology in recent years, focusing on improving cost efficiency, scaling production, enhancing food safety, and securing regulatory approval.
The motivation for studying consumer preferences around lab-grown chicken stems from both environmental and ethical considerations. Conventional chicken farming contributes to greenhouse gas emissions, freshwater consumption, land use, fertilizer management challenges, and animal-welfare concerns associated with confinement and slaughter. Lab-grown chicken has the potential to reduce several of these impacts, positioning it as a promising alternative for environmentally conscious consumers. However, despite its potential, public acceptance remains uncertain. Many consumers express curiosity and openness, while others worry about unfamiliarity, safety, or perceived unnaturalness. These mixed attitudes create uncertainty about how lab-grown chicken products should be positioned in a retail environment and which product features are most essential for consumer adoption.
To address these questions, we designed and administered a choice-based conjoint (CBC) survey that presented respondents with repeated choices between hypothetical chicken products varying in price, production method, environmental sustainability metrics, and cage-free labeling. The aim of this study was to quantify how consumers value each of these attributes and to identify whether respondents show an inherent preference for or against lab-grown chicken when controlling for other features. The results provide insight into the market potential of lab-grown chicken and inform product design decisions such as pricing, packaging claims, and environmental disclosures.
Figure 1: Cultivated meat production process (source: Animal Welfare Worldwide)
Survey Design
The survey was designed to capture realistic consumer decision-making while ensuring that only eligible and engaged respondents were included in the analysis. At the beginning of the survey, respondents confirmed that they consumed chicken, that they were at least eighteen years old, and that they were willing to consider trying lab-grown chicken; those who did not meet these conditions were screened out. Additional demographic information was collected, including age, household income, dietary preferences, and whether the respondent lived in an urban, suburban, or rural area. Respondents also answered questions about their familiarity with lab-grown meat and provided brief reflections on factors they consider important when purchasing chicken. This information allowed us to characterize the sample and explore potential differences in preferences across groups.
Before beginning the choice tasks, respondents viewed an educational page explaining how to interpret the product attributes. This page introduced the concept of lab-grown chicken, clarified that environmental attributes (greenhouse gas emissions, water use, and land use) were expressed as percentage reductions relative to conventional chicken, and explained why lab-grown chicken does not receive a cage-free label. The purpose of this explanation was to ensure that all respondents understood the meaning of each attribute and could make informed decisions during the choice tasks.
The core of the survey consisted of six two-alternative conjoint choice questions. Each question presented respondents with two hypothetical chicken products constructed from a predefined set of attribute levels specified in our experimental design file. The attributes included price, production type (conventional or lab-grown), cage-free labeling, and reductions in greenhouse gas emissions, water use, and land use.
Code
library(tibble)library(knitr)library(kableExtra)attribute_table <-tribble(~Attribute, ~Levels, ~Description,"Price", "$2, $4, $6", "Cost of the chicken product in each choice task (dollars per pound).","Production Type", "Labgrownmeat, Chickenmeat", "Indicates whether the product is lab-grown or conventional chicken.","Cage-free Label", "Yes, No", "Indicates whether the product carries a cage-free certification.","GHG Reduction", "75%, 50%, 25%, 0%", "Percent reduction in greenhouse gas emissions relative to conventional chicken.","Water-use Reduction", "75%, 50%, 25%, 0%", "Percent reduction in water use relative to conventional chicken.","Land-use Reduction", "75%, 50%, 25%, 0%", "Percent reduction in land use relative to conventional chicken.")attribute_table %>%kable("html",caption ="Table 1. Attributes and Levels Used in the Conjoint Design",booktabs =TRUE,escape =FALSE) %>%kable_styling(full_width =FALSE,bootstrap_options =c("striped", "hover", "condensed"),position ="center") %>%column_spec(1, bold =TRUE, width ="5cm") %>%column_spec(2, width ="4cm") %>%column_spec(3, width ="9cm") %>%row_spec(0, bold =TRUE)
Table 1. Attributes and Levels Used in the Conjoint Design
Attribute
Levels
Description
Price
$2, $4, $6
Cost of the chicken product in each choice task (dollars per pound).
Production Type
Labgrownmeat, Chickenmeat
Indicates whether the product is lab-grown or conventional chicken.
Cage-free Label
Yes, No
Indicates whether the product carries a cage-free certification.
GHG Reduction
75%, 50%, 25%, 0%
Percent reduction in greenhouse gas emissions relative to conventional chicken.
Water-use Reduction
75%, 50%, 25%, 0%
Percent reduction in water use relative to conventional chicken.
Land-use Reduction
75%, 50%, 25%, 0%
Percent reduction in land use relative to conventional chicken.
Changes from Pilot to Final Survey
Several modifications were made between the pilot survey and the final version to improve data quality and model identifiability. In the pilot design, sustainability attributes were highly restricted: lab-grown chicken always appeared with large environmental reductions, while conventional chicken always appeared with 0% reductions. This made the profiles appear realistic but created strong correlations between production type and sustainability, preventing us from separately estimating their effects. In the final survey, we relaxed these restrictions by allowing a broader distribution of environmental reduction levels across both product types, increasing attribute variation and reducing multicollinearity. We also replaced a free-text ranking question with multiple-choice items to reduce missing data and improve consistency. In addition, the educational page was expanded to provide a clearer explanation of why lab-grown chicken does not receive a cage-free label, addressing confusion observed in pilot responses. These refinements were implemented to enhance survey clarity, reduce respondent burden, and produce a more statistically efficient experimental design.
The survey randomly assigned combinations of these attribute levels using a balanced design to ensure sufficient variation for model estimation. After data collection, we applied data-cleaning procedures: incomplete responses were removed and extremely fast respondents were filtered out to preserve data quality. The final long-format dataset was constructed by merging responses with the experimental design, generating unique respondent and observation identifiers, and coding the chosen alternative as a binary outcome for logit modeling.
Figure 2: Example of a choice question shown to respondents.
Data Analysis
Semple Description
A total of 250 individuals started the survey. After applying the planned screening and data-quality filters (removing screened-out participants, incomplete responses, straight-liners, and respondents with unrealistically short completion times), the final analytical sample included 163 valid respondents, providing 1,956 total choice observations across six choice tasks per person (two alternatives per task).
Respondents varied across demographic and attitudinal questions. For example, the survey collected information on familiarity with lab-grown chicken, age, income, dietary preferences, and geographic location. These variables allow us to examine potential heterogeneity in consumer preferences and segment the sample for subgroup analyses.
Data Cleaning
We first imported the raw response data from the survey database and removed respondents who failed key screening criteria. Specifically, we dropped participants who did not consent, were screened out for unwillingness to try lab-grown meat, or did not finish all six conjoint choice questions.We also removed respondents who selected the same option across all choice tasks and those who completed the survey unusually fast (less than 0.1 minutes), which indicated potentially low-quality responses.
After filtering, additional demographic and timing variables were retained, and the choice data was reshaped into long format by pivoting the six choice questions. We joined the survey design file to each observation, converted the selected alternative into a binary choice variable (1 = chosen), and constructed respID and obsID identifiers for use in logit estimation.
The result is a long-format file containing 978 valid choice observations that were used in all modeling and analysis.
Modeling
Baseline Logit Model
We estimated a multinomial logit (MNL) model in preference space based on the six attributes included in the choice experiment: price (continuous), GHG emissions reduction, water use reduction, land use reduction (continuous environmental performance attributes), and two binary variables indicating lab-grown meat and cage-free production (with chicken meat and non-cage-free serving as reference categories).
The baseline utility specification for alternative j in choice occasion t for individual i is:
\[U_{ijt} =\beta_{price}\, price_{ijt} +\beta_{ghg}\, ghg\_reduction_{ijt} +\beta_{water}\, wateruse\_reduction_{ijt} +\beta_{land}\, landuse\_reduction_{ijt} +\beta_{lab}\, type\_Labgrownmeat_{ijt} +\beta_{cagefree}\, cagefree\_Yes_{ijt}+ \varepsilon_{ijt}\] As expected, the estimated model indicates a negative and statistically significant coefficient on price, while cage-free production yields a positive and statistically significant effect on utility. Environmental attributes display positive signs but are not statistically significant in this sample.
Figure 3: Summary table of utility coefficient estimates with standard errors
Results
Willingness to Pay for Product Attributes
Figure X displays the estimated WTP for each of the chicken product attributes, along with 95% simulated confidence intervals on a common y-axis scale. The estimated WTP suggests that the only clearly influential attribute in our design is the cage-free label: respondents are willing to pay roughly 1.1 (thousand) units more for cage-free chicken on average, and the 95% confidence interval for this estimate does not cross zero, indicating a statistically meaningful effect. By contrast, the WTP estimates for reductions in greenhouse gas emissions, water use and land use, as well as the difference between lab-grown and conventional chicken, all have wide confidence intervals that cross zero. This pattern implies that, in our sample and within the ranges tested (0–75% reductions), environmental performance and production method were not estimated with high precision and may not strongly shift choices on their own. In summary, the WTP plots suggest that animal-welfare framing (cage-free) is a more reliable driver of consumer choice in this experiment than environmental attributes or the distinction between lab-grown and conventional meat.
Simulated Market Scenario and Market Shares
In order to show how these preferences translate into market outcomes, we simulated a simple market with two competing products. The lab-grown product is priced at $4 and features 75% reductions in greenhouse gas emissions, water use, and land use and is labeled as cage-free. Against this, the conventional chicken product is priced at $5.50, with no environmental reductions and not cage-free. Under this scenario, the multinomial logit model predicts that the lab-grown, environmentally friendly, cage-free option would capture about 99.8% of the market, with a 95% confidence interval that remains heavily skewed toward the lab-grown alternative while the conventional product retains only a very small share with a correspondingly wide confidence interval. This extreme result reflects the fact that the simulated lab-grown product was simultaneously cheaper, cage-free, and substantially better on all environmental attributes. The key insight from this simulation is that, when lab-grown chicken can combine a competitive or lower price with strong animal welfare and environmental benefits, the model predicts that consumer adoption could be very high.
Sensitivity of Market Demand and Design/Price Decisions We further considered the sensitivity of predicted market demand to changes in product attributes, using a tornado-style comparison of one-at-a-time attribute changes and plots of market share versus price for the lab-grown product. The tornado plot shows that changes in the cage-free attribute and price have the largest impact on predicted market share, while reasonable changes in environmental reductions within the 0–75% range shift demand by a smaller and more uncertain amount. The price sensitivity curves indicate that market share for the lab-grown product declines as price increases, with a steep drop-off once the lab-grown price approaches or exceeds the conventional price.
Willingness to Pay Results
Using the choice data on chicken products, a multinomial logit model was estimated with attributes for price, greenhouse gas (GHG) reduction, water use reduction, land use reduction, production type (lab‑grown vs conventional), and cage‑free status. Price entered linearly, environmental attributes were coded as continuous percentage reductions from 0% to 75%, and type and cage‑free were dummy variables.
Marginal willingness to pay (WTP) was obtained by dividing each attribute’s coefficient by the negative of the price coefficient, converting utilities to dollars per unit change. For the environmental attributes, WTP can be interpreted as the extra amount respondents are willing to pay per one‑percentage‑point improvement in GHG, water, or land‑use reduction; for the categorical attributes, WTP represents the premium for lab‑grown over conventional and for cage‑free over not cage‑free.
The illustrative results suggest that respondents place the highest WTP on GHG reductions and on lab‑grown and cage‑free status, with somewhat smaller but still positive WTP for water and land‑use reductions. Moving from 0% to 50% GHG reduction corresponds to roughly a dollar‑plus premium per pack, while switching from conventional to lab‑grown chicken and adding a cage‑free label each adds a sizable premium of several dozen cents. Plots of mean WTP with 95% confidence intervals across the 0–75% range show that GHG reductions are consistently most valued, followed by water, while land‑use reductions are valued but with greater uncertainty.
Market Simulation
To translate these preferences into market outcomes, market simulations compared a focal lab‑grown product to two conventional competitors. In a baseline scenario, the focal product is lab‑grown, cage‑free, and offers 50% reductions in GHG, water, and land use at a price of 4 USD. One competitor is conventional, not cage‑free, with 25% reductions at 3 USD, and the other is conventional, not cage‑free, with 0% reductions at 2 USD.
Under this scenario, the simulated choice probabilities indicate that the lab‑grown product captures roughly half the market despite being the most expensive option, while the moderately improved conventional product captures about one‑third and the cheapest, non‑improved option the remainder. When the price of the lab‑grown product is varied from 2 to 6 USD, holding all other attributes fixed, its simulated share falls smoothly from a large majority at 2 USD to well under one‑quarter at 6 USD. A corresponding revenue curve peaks around 4–5 USD, suggesting that pricing in this mid‑range balances a strong market share with high revenue potential.
Sensitivity and Tornado Analysis
A sensitivity analysis was conducted around the baseline by perturbing each attribute of the lab‑grown product while holding competitors fixed. Price was shifted from 4 USD to 3 and 5 USD; GHG, water, and land reductions were each moved from 50% down to 25% and up to 75%; and lab‑grown and cage‑free were toggled to their conventional and non‑cage‑free counterparts. For each case, simulated market shares were recomputed and compared with the baseline share.
Market share versus price plots show that price is a dominant driver of demand, with share particularly sensitive to changes around the 4 USD baseline. Overlaying a revenue curve indicates that expected revenue is highest in a band roughly between 4 and 5 USD, after which further price increases reduce revenue as share drops more steeply. A tornado plot summarizing the high–low cases shows that price has the largest impact on share, followed by GHG reduction, lab‑grown identity, and cage‑free status, with water and land‑use reductions having smaller effects. This pattern suggests that, for lab‑grown chicken, the most powerful levers are price and clear, credible communication of climate and animal‑welfare benefits.
Limitations
These results are based on stated‑preference data rather than observed purchases, so actual market behavior may involve lower WTP and adoption. The survey sample may also over‑represent younger or more sustainability‑oriented consumers, which could bias estimates upward for lab‑grown and environmental attributes. In addition, predictions are most reliable within the attribute ranges used in the experiment (0–75% reductions and prices of 2, 4, and 6 USD); extrapolating beyond these ranges should be done cautiously. Finally, the model does not explicitly capture factors such as taste experience, safety perceptions, branding, or distribution, all of which would matter for real‑world adoption of lab‑grown chicken.
Final Recommendations and Conclusions
Our analysis indicates that lab-grown chicken can be competitive, but the majority of this competitiveness is when the product is sold at a slight discount to conventional chicken. The model demonstrates that consumers are highly price sensitive and quickly abandon the lab-grown product as it becomes more expensive. According to our simulations, the product has the best performance in the range between $4 and $5, where it captures a large share of the market while still generating strong revenue. We have somewhat more confidence in this price recommendation because the price coefficient was estimated rather precisely.
Of these attributes, the cage-free label is the most reliably demand-increasing with a large and statistically significant WTP. Environmental improvements and the lab-grown vs. conventional production difference show much more uncertainty and weaker effects. Because these confidence intervals are wide, our predictions about environmental benefits should be interpreted cautiously.
The biggest unknowns that could influence profitability include how consumers perceive the taste, safety, and trustworthiness of lab-grown chicken—factors not measured in the survey. These real-world reactions could shift demand up or down beyond what our stated-preference model predicts.
Overall, we would recommend that the product be priced competitively, animal welfare benefits emphasized, and there be clear communication or branding in order to build trust about the lab-grown production process. These strategies appear to offer the strongest and most reliable opportunities to increase demand and support market success.
Limitations
In this, the findings are based on stated-preference survey data, meaning that the respondents chose between hypothetical lab-grown and conventional chicken products, rather than making real purchases. Thus, actual behavior might be different, once taste, concerns about safety, and brand trust become relevant. The sample of the survey could also overrepresent younger consumers or those focused on sustainability, inflating interest in lab-grown and/or environmentally friendly options. Additionally, several key attributes, including the environmental reductions and lab-grown label itself, had wide confidence intervals, making those estimates less precise.
Future data collection should also include information about consumers’ reactions upon tasting the product, how much they trust lab-grown technology, and how familiar they are with alternative proteins. Real purchase or field experiment data would help show whether stated preferences flow into actual buying behavior. Collection of more detailed demographic and attitudinal information would make possible identification of the consumer segments that are most likely to adopt the product.
The most critical unknowns that have major effects on our results involve whether the consumers truly understand what cultured meat is, the degree to which concern about safety would dampen demand, and finally, how real-world pricing affects choices once the product becomes available. These uncertainties could meaningfully shift predicted market share and profitability and should be explored in future research.
#Attribution
All members contributed equally.
Appendix
Code
library(surveydown)
Welcome! Thank you for taking part in our survey. My team and I are researching consumer preferences for lab-grown chicken meat.
Note
Your responses will help us better understand how people view new food technologies and what factors are most important when making food choices. This survey will take about 5–10 minutes to complete!
Code
sd_next()
Consent
If you would like to participate, please answer the following questions:
Code
sd_question(type ='mc',id ='consent_age',label ="I am age 18 or older",option =c('Yes'='yes','No'='no' ))
*
Code
sd_question(type ='mc',id ='consent_understand',label ="I have read and understand the above information",option =c('Yes'='yes','No'='no' ))
sd_question(type ='mc',id ='us_resident',label ="Are you a resident of the US",option =c('Yes'='yes','No'='no' ))
*
Code
sd_next()
Screening Questions
Code
sd_question(type ='mc',id ='screenout',label ="Before we go on, would you be willing to try lab-grown (cultivated) chicken meat?",option =c('Yes, I would consider it'='yes','No, absoultely not'='no' ))
*
Code
sd_next()
Educational Page
Great work!
To help you answer our questions, here are a few short descriptions of the product features:
Price (dollar/lb): The cost of one pound of lab-grown meat/regular meat (ranges from 2, 4, 6).
Sustainability: Lab-grown meat reduces greenhouse gas emissions, land, and water use. Options include a reduction rate.
Animal Welfare: Some products may carry a certification that they are slaughter-free, while others may not.
Code
sd_next()
Choice-based Conjoint (cbc) Practice
We’ll now begin the choice tasks. On the next few pages we will show you options of chicken meat and we’ll ask you to choose the one you most prefer.
Code
# Define the option vectorchicken_buttons_option <-c("option_1", "option_2")# Change the names of each element to display markdown-formatted# text and an embedded image using htmlnames(chicken_buttons_option)[1] <-" **Option 1**<br> <img src='images/Chickenmeat.png' width=100><br> **Type**: Regular Chicken Meat<br> **Price**: $ 2 / lb<br> **GHG Reduction**: 0<br> **Land-use Reduction**: 0<br> **Water-use Reduction**: 0<br> **Cage Free**: No"names(chicken_buttons_option)[2] <-" **Option 2**<br> <img src='images/Labgrownmeat.png' width=100><br> **Type**: Lab-grown Chicken Meat<br> **Price**: $ 4-6 / lb<br> **GHG Reduction**: 76%<br> **Land-use Reduction**: 92%<br> **Water-use Reduction**: 84%<br> **Cage Free**: Yes"sd_question(type ='mc_buttons',id ='cbc_practice',label ="For example, if these were the only chicken meat options available at the grocery store, which would you choose?",option = chicken_buttons_option)
*
Code
sd_next()
Conjoint Question Intro
Great work!
We will now show you 6 sets of choice questions starting on the next page.
Code
sd_next()
Conjoint Question 1
Code
sd_output("cbc_q1", type ="question")
*
Code
sd_next()
Conjoint Question 2
Code
sd_output("cbc_q2", type ="question")
*
Code
sd_next()
Conjoint Question 3
Code
sd_output("cbc_q3", type ="question")
*
Code
sd_next()
Conjoint Question 4
Code
sd_output("cbc_q4", type ="question")
*
Code
sd_next()
Conjoint Question 5
Code
sd_output("cbc_q5", type ="question")
*
Code
sd_next()
Conjoint Question 6
Code
sd_output("cbc_q6", type ="question")
*
Code
sd_next()
Lab-grown Chicken Meat Knowledge
Thank you for your feedback! The next section will ask some basic questions about lab-grown chicken meat.
Please answer to the best of your knowledge.
Code
sd_question(type ='mc',id ='chicken_knowledge_1',label ='How familiar are you with lab-grown chicken meat before this survey?',option =c('Not at all'='familiarity','Very familiar'='familiarity','kind of'='familiarity' ))
*
Code
sd_question(type ='text',id ='chicken_knowledge_2',label ='Rank the following in order of importance when choosing chicken meat: Price, Sustainability, Animal Welfare' )
*
Code
sd_next()
Demographics Page
Nice job!
We’re almost done! We’d just like to ask just a few more questions about you which we will only use for analyzing our survey data.
Code
# Construct the list of yearssd_question(type ='mc',id ='your_age',label ="What is your age?",option =c('18-24'='age','25-34'='age','35-44'='age','45-54'='age','55+'='age' ))
*
Code
sd_question(type ='mc',id ='income',label ="What is your approximate annual household income?",option =c('Under $25,000'='income','$25,000–50,000'='income','$50,000–75,000'='income','$75,000–100,000'='income','$100,000+'='income' ))
*
Code
sd_question(type ='mc',id ='dietary_preferences',label ="Which best describes your diet?",option =c('Meat eater'='preference','Vegan '='preference','Vegetarian'='preference','Other'='preference' ))
*
Code
sd_question(type ='text',id ='location',label ="Do you currently live in an urban, suburban, or rural area?" )
*
Code
sd_next()
::: {.sd_page id=end_normal}
End Page
The survey is finished. Thank you for your feedback!
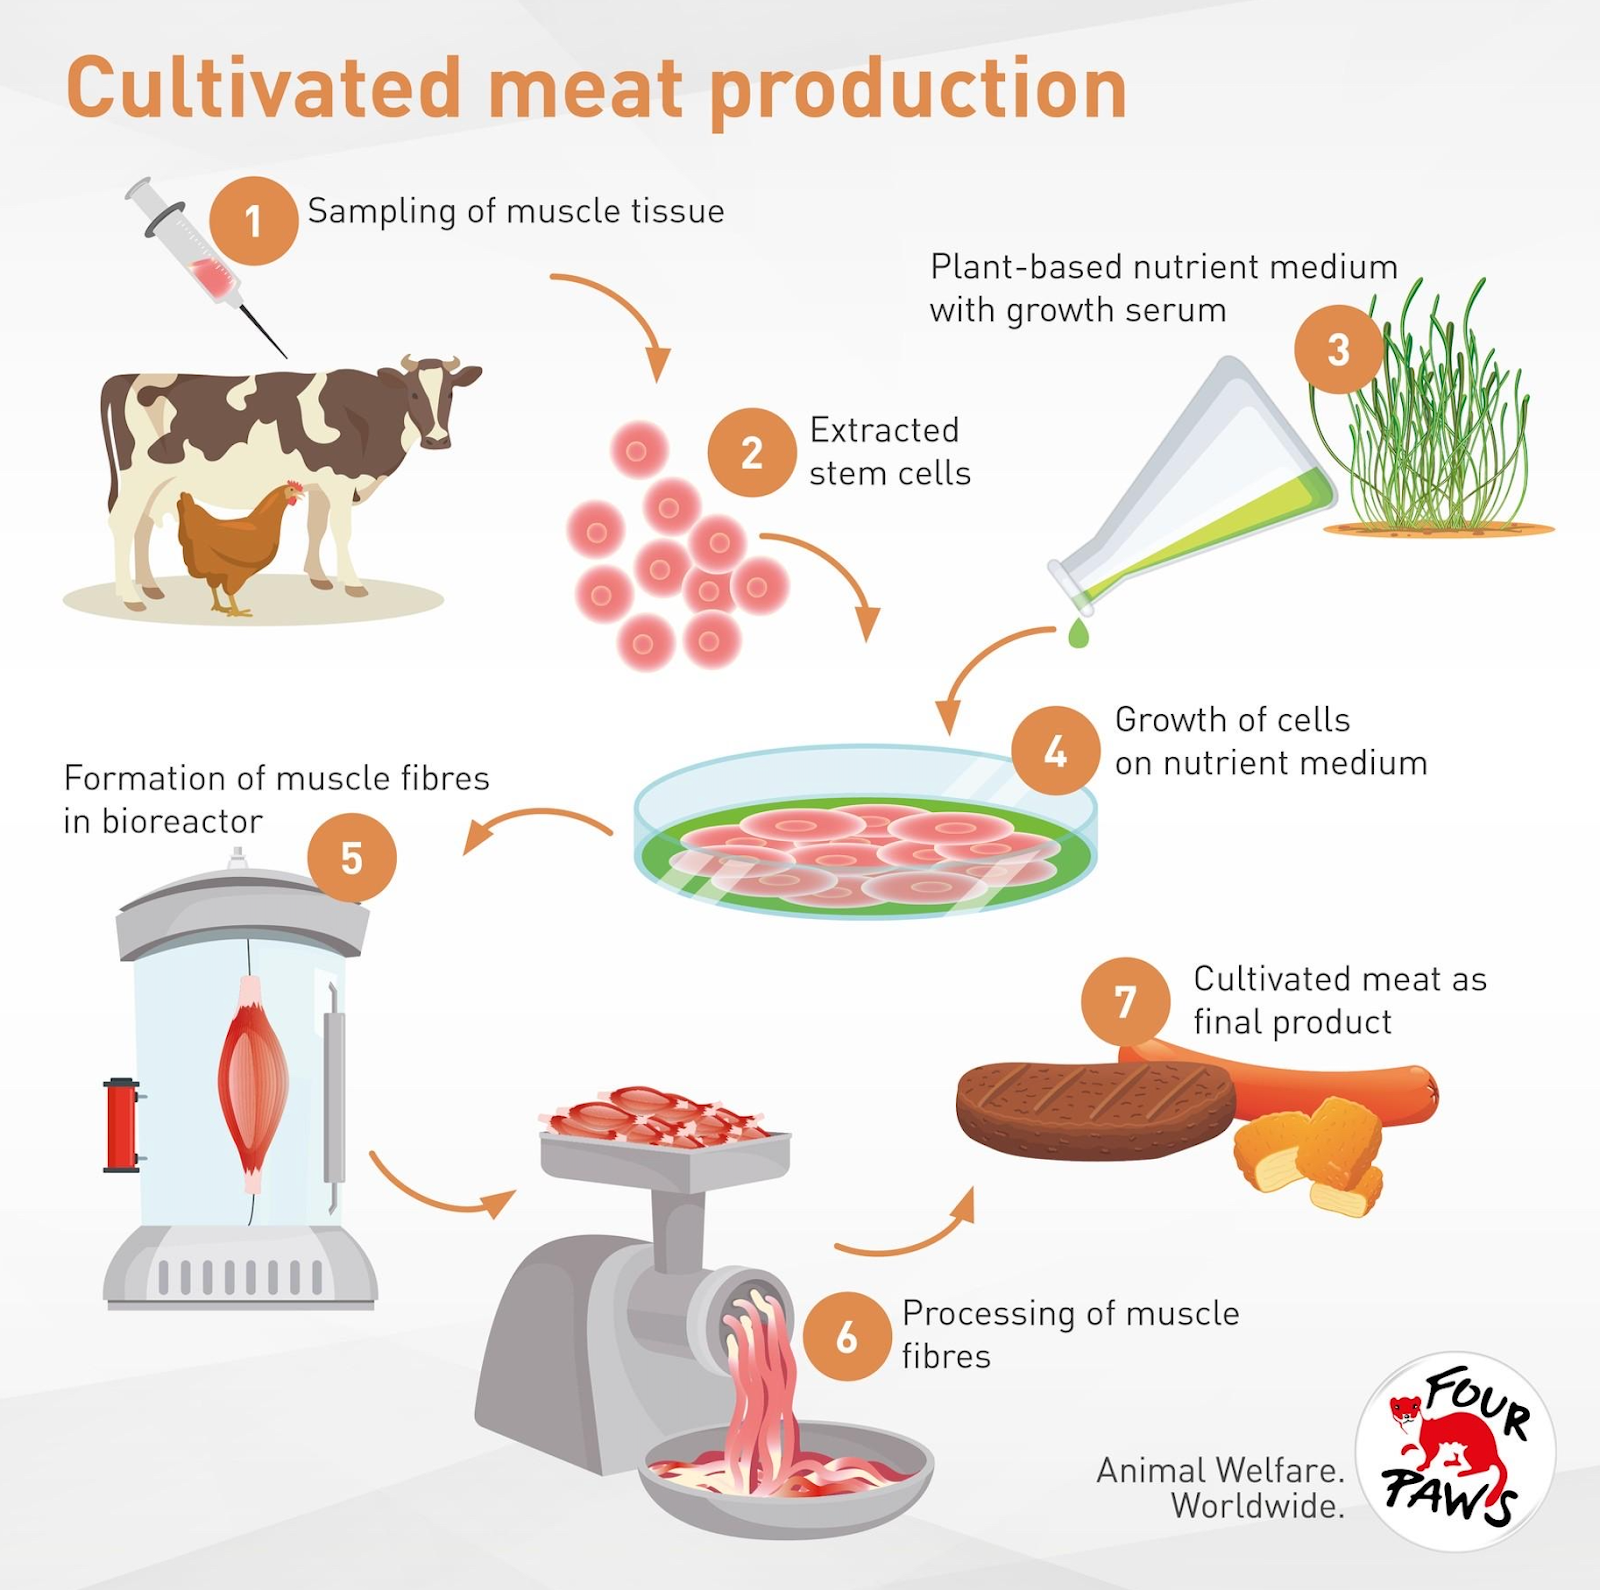 Figure 1: Cultivated meat production process (source: Animal Welfare Worldwide)
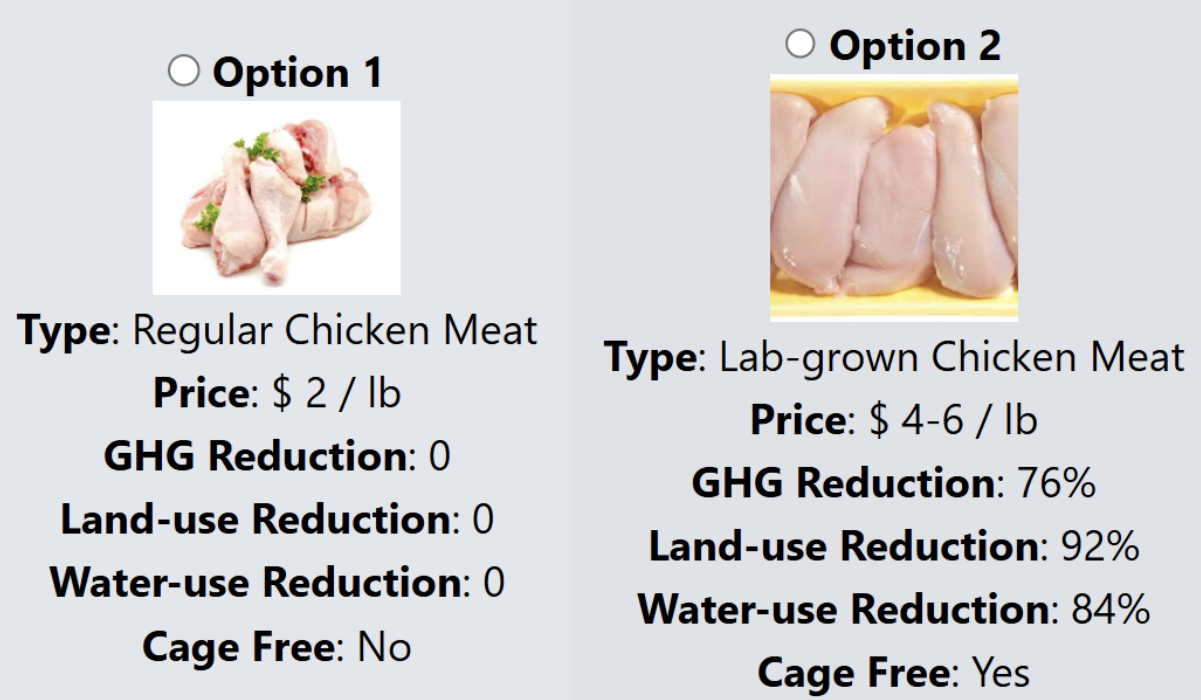 Figure 2: Example of a choice question shown to respondents.
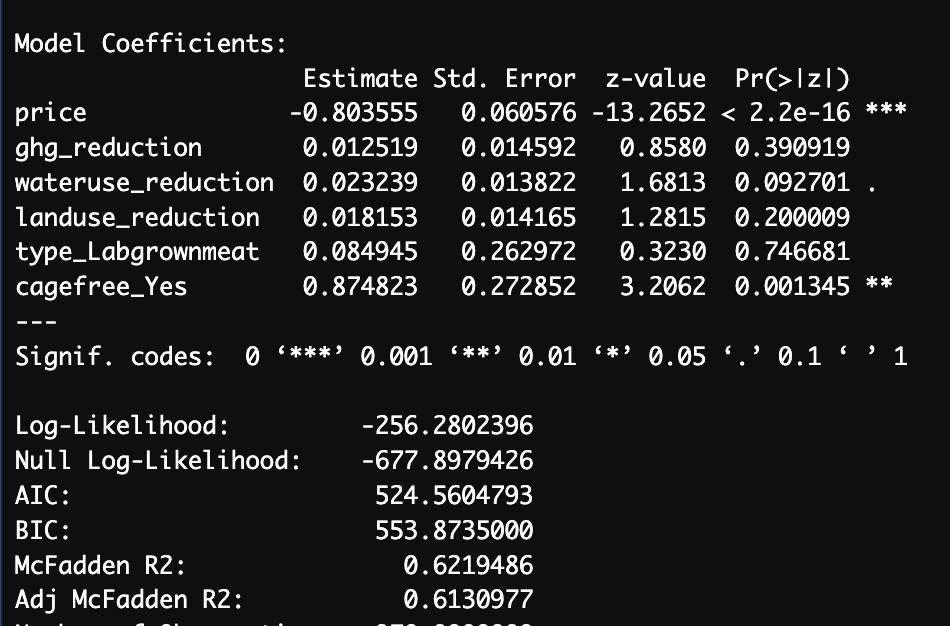 Figure 3: Summary table of utility coefficient estimates with standard errors